
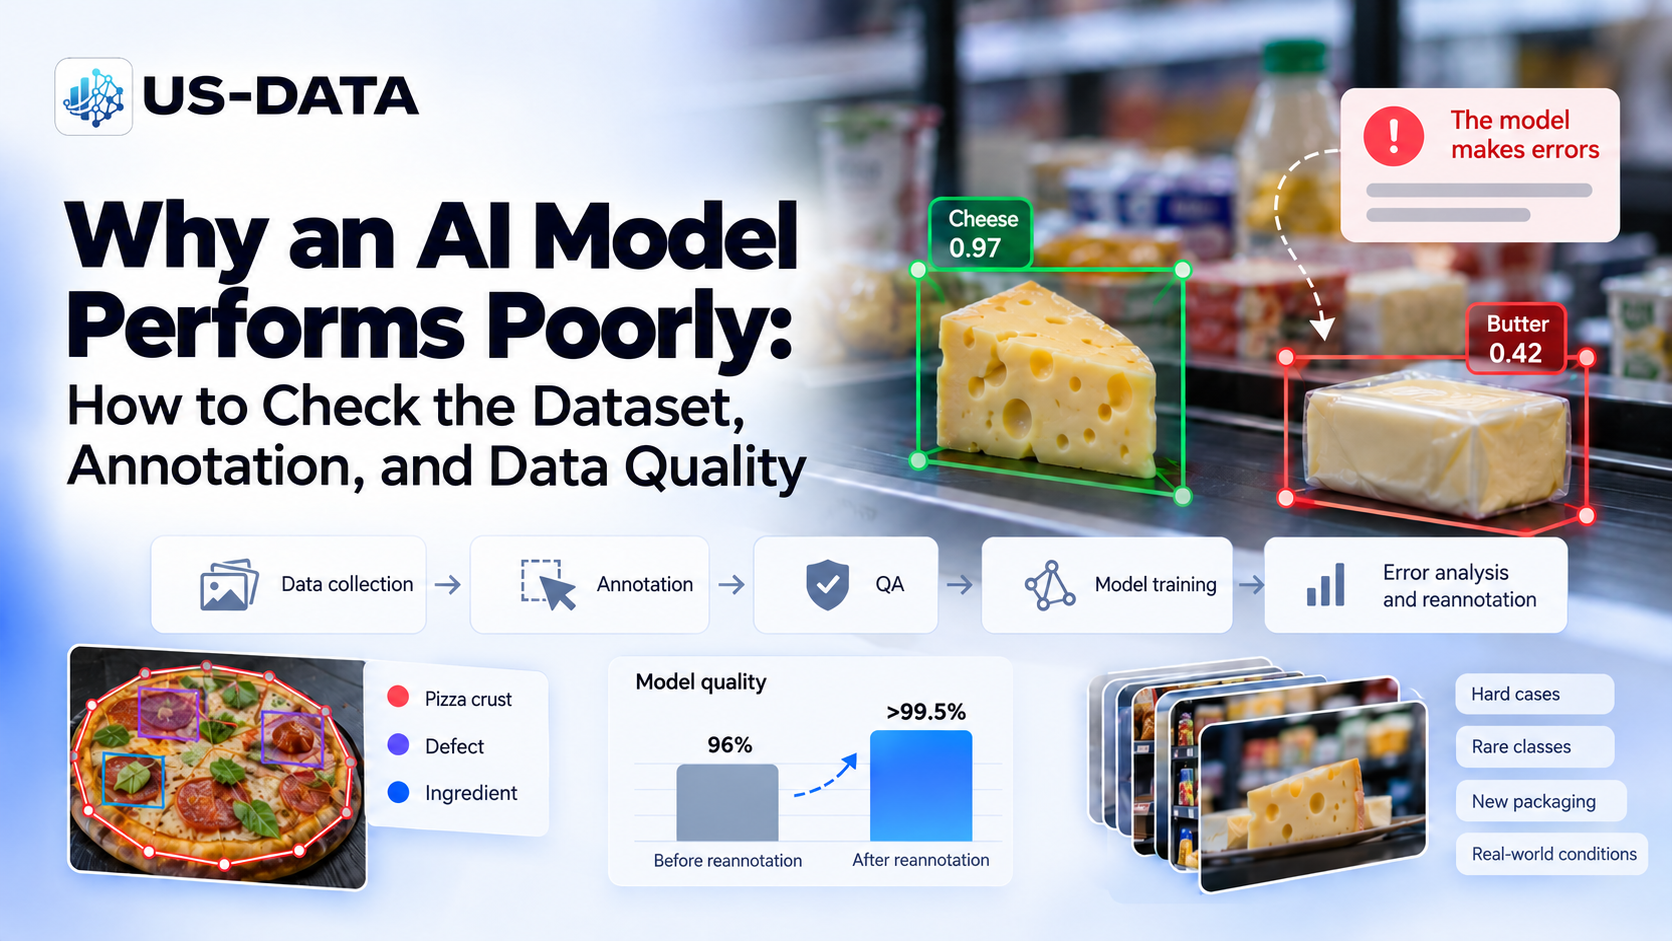
A practical guide to diagnosing ML model errors, designing dataset coverage, annotation QA, hard cases, data drift, continuous annotation, and data governance — based on real US-DATA projects.
1. When the Model Makes Mistakes, First Find Out Where
When an ML model no longer delivers the expected quality, the first instinct is often to look at the model itself: change the architecture, tune different hyperparameters, increase the number of training epochs, or try a more complex backbone. Before rebuilding the model, however, it is worth answering a simpler question: where exactly does it fail, and what do those failures have in common?
An average metric tells only part of the story. A model can perform very well on most data and still fail systematically in a small number of scenarios that are critical to the business. It may recognize most products correctly while confusing two visually similar categories. Or it may perform well on the original test set and then degrade after a packaging redesign.
Start the diagnosis not with “How do we improve the model?” but with “Which data does the model fail to handle correctly?”
Only after that should the team decide whether the model itself needs to change or whether the training data need to be improved.
High overall quality does not mean the task is solved
A good example comes from a US-DATA project for grocery retail. The client already had an ML model that analyzed video and identified products. Overall, the system showed a strong result — about 96% according to the project’s internal quality metric. But the remaining errors were not distributed randomly.
The model failed primarily where product categories were visually similar. One such case was cheese versus butter.
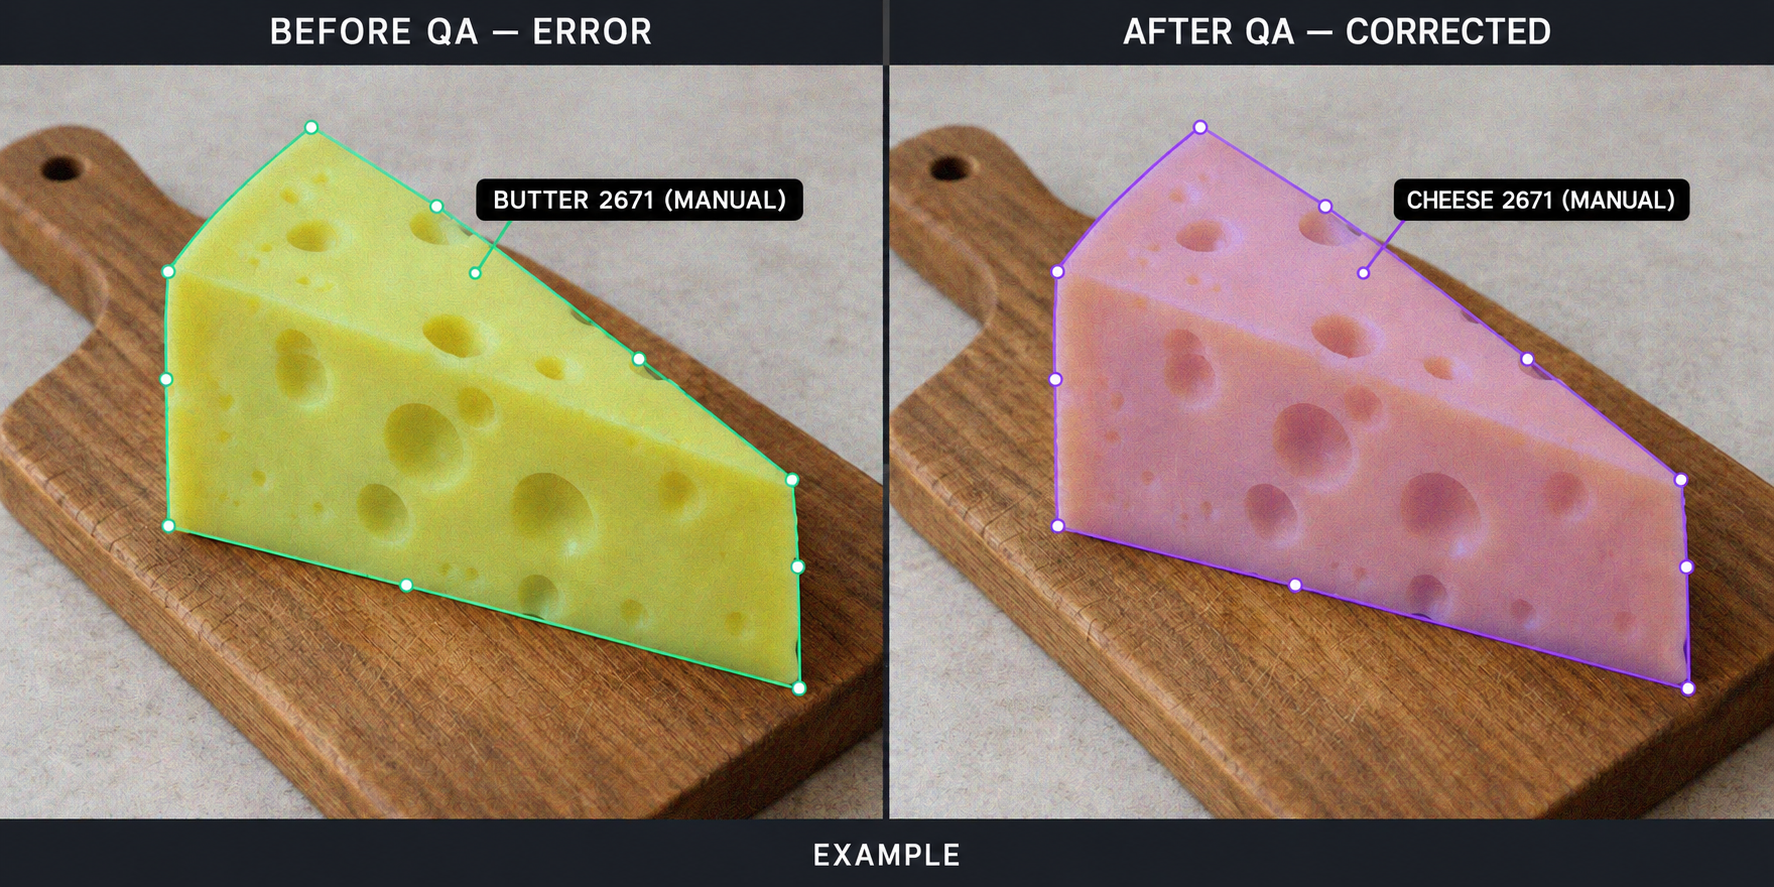
The key detail is that the error is not in the polygon. The object is outlined accurately enough. The error is semantic: the wrong class is assigned to the image.
This exposes an important limitation of basic annotation QA. A team can perfectly validate bounding-box coordinates, masks, and polygons and still provide poor training data if class labels are assigned inconsistently.
Look for error patterns, not isolated mistakes
In this project, model quality was monitored in production. Product recognition results were compared with actual checkout sales. This created an additional control loop: if the point-of-sale system showed that an item had been sold, the AI should have recorded the corresponding event.
When sales statistics and AI output began to diverge, the client team identified suspicious video segments and manually reviewed a sample. Instead of a vague statement such as “the model works at 96%,” the team obtained something much more actionable: which product, under which conditions, and with which neighboring class the model was most likely to confuse it.
Problematic examples were then sent to US-DATA for additional annotation. The process was iterative: a discrepancy between business data and AI output triggered manual review; confirmed hard cases were returned to the dataset; the model was retrained and evaluated again.
What targeted reannotation achieved
Rather than simply adding more random product images, the team focused on the categories and situations where the model had already demonstrated weaknesses.
After several iterations, the project’s internal quality metric increased from approximately 96% to more than 99.5%.
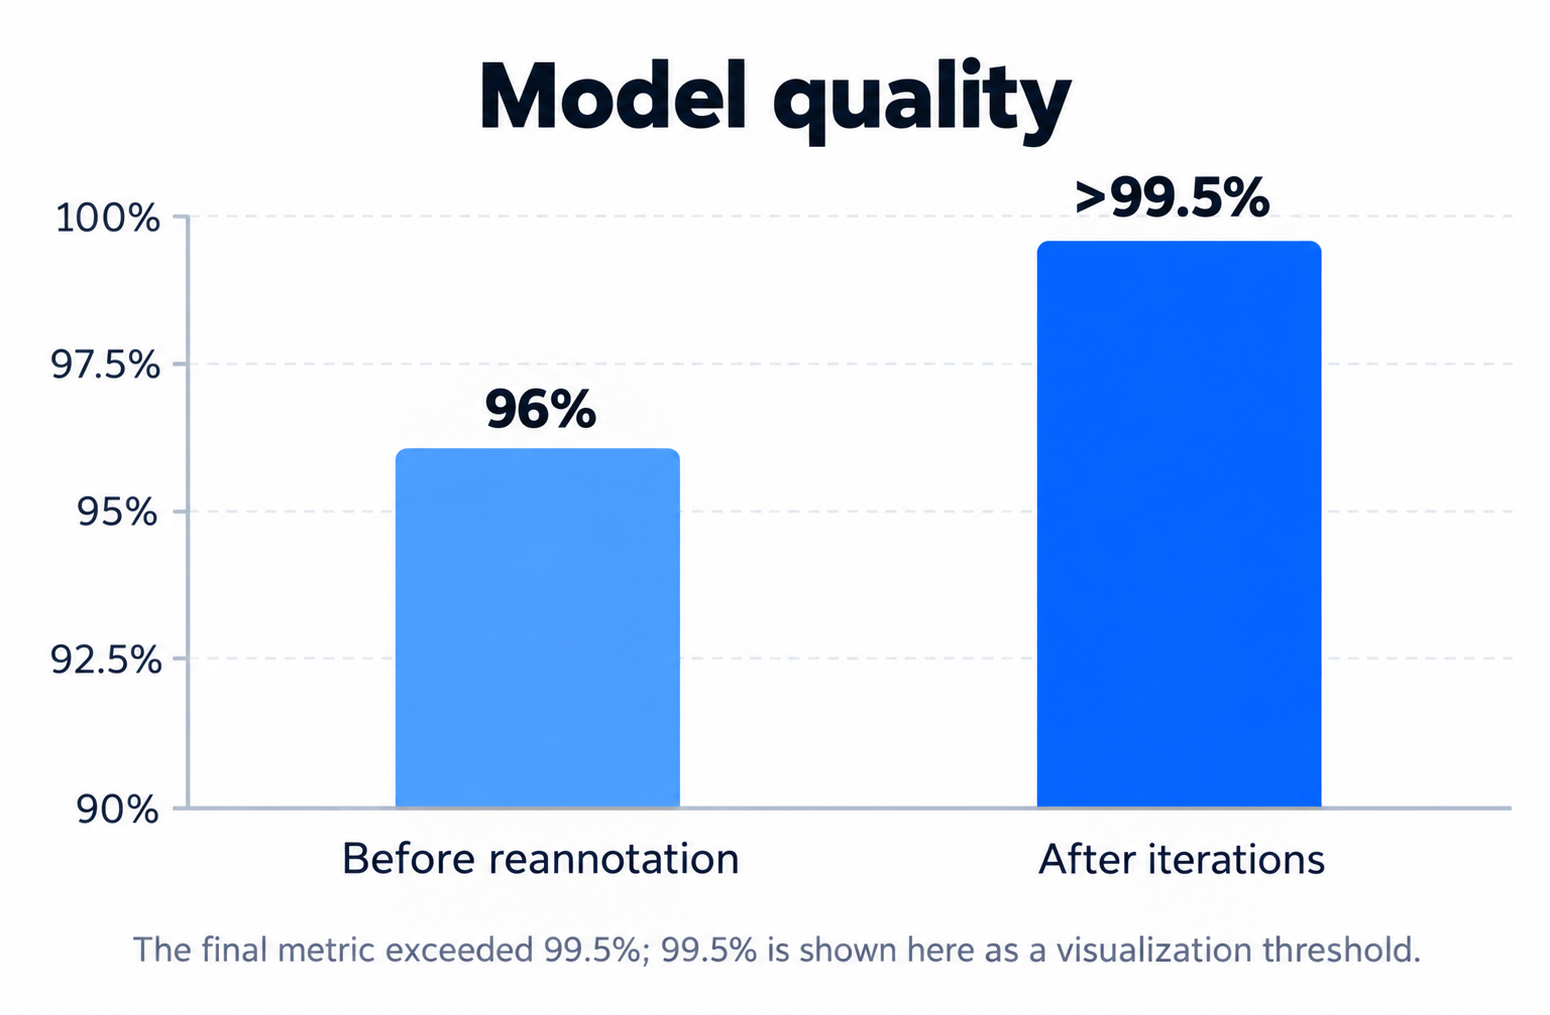
The original dataset was not generally too small. The remaining room for improvement was concentrated in the kinds of examples the model found difficult. This is why total data volume and the information value of the data for a specific model error must be treated as different things.
If a model fails on one narrow scenario, ten thousand additional easy images may change almost nothing. A few hundred well-selected difficult examples can be more valuable. This approach is often called targeted annotation.
Production continuously creates new difficult cases
There is another reason a strong initial dataset eventually becomes insufficient: the real world changes. In the same retail project, US-DATA worked with roughly ten product categories, while packaging designs were updated regularly. In some months there were between 3 and 25 design changes.
For a person, a redesigned pack of butter is still butter. For computer vision, the visual representation may change significantly: color, logo placement, typography, product imagery, contrast, decorative elements, or even package shape.
Therefore, an ML system does not stop evolving after the first successful deployment. Production must continue to feed new errors back into the data lifecycle.
The first audit step: segment the errors
When model quality is unsatisfactory, one aggregate metric is not enough. Errors should be broken down into groups.
- Which classes are confused with one another?
- Are there conditions in which quality drops sharply — low light, glare, another camera, an unusual viewpoint, a new package, or partial occlusion?
- Does the model fail equally across all products, or is one category significantly worse than the others?
- Do failures appear mainly after deployment?
- Has the environment itself changed since the dataset was created?
The goal is to move from “The model is not good enough” to a much more specific statement such as: “The model confuses classes A and B under these conditions, and these examples are underrepresented in the training dataset.”
When to investigate the model architecture
Data do not explain every ML problem. The cause may be the architecture, preprocessing, the loss function, hyperparameters, computational limits, or even the ML problem formulation itself.
A practical sequence is therefore: localize the errors, inspect the data and labels, evaluate coverage of difficult scenarios, verify the train/validation/test split, and only then decide whether the model approach must change. This prevents teams from spending weeks redesigning a model to compensate for a gap that actually exists in a few missing or incorrectly labeled data slices.
2. One Thousand Images Is Not Yet a Dataset: Designing Data Coverage
One of the most common ways to estimate a future dataset is to count images: “We need 10,000 photos,” “At least 1,000 examples per class,” or “Let’s add a few thousand more frames and the model will improve.” The number of images alone, however, says very little about how much of the real world those images cover.
A dataset can contain 10,000 nearly identical images of the same product under the same lighting and from the same viewpoint. Formally, it is large. But once the lighting changes, the object rotates, or an unusual defect appears, the model encounters a situation that was effectively absent from training data.
Dataset design therefore depends not only on volume but on coverage of the variability the model will face in operation.
Data quality begins before annotation
In one US-DATA project, the task was to prepare training and validation data for computer-vision models that assess product ripeness and visual anomalies. In this case, the team could not simply receive an image archive and start labeling. The dataset had to be designed and collected.
US-DATA staff participated on site at the warehouse: they helped organize the shooting area, prepare products, control viewpoints and lighting conditions, and verify image quality before annotation began.

This case illustrates an important principle: in some ML projects, data work begins outside the annotation interface. If the model must distinguish ripeness, surface damage, or defects, a mistake during capture can be just as damaging as an annotation error.
Why not just collect images from open sources?
The project used the client’s actual product range. This matters in tasks where the target is not a generic category such as “apple,” but the condition of specific SKUs.
Within a single SKU, examples may differ in shade, size, shape, surface texture, characteristic elements, ripeness, and types of damage. Differences between varieties can be even larger.
The right question is not “How many apple images do we have?” but “Which apple variants, under which conditions, are represented in those images?”
A minimum of 1,000 images was only the starting point
For each SKU, the project required at least 1,000 images. The specification went much further:
- The object should be roughly centered in the image.
- It should occupy 60–90% of the frame.
- The background should be uniform.
- The object should be shown from different viewpoints.
- The object should be in focus.
- Image resolution should be at least 2 MP.
- The dataset should include the defects and conditions characteristic of the SKU.
The target was not the number one thousand itself. The target was to ensure that this thousand contained enough diversity for the model to learn robust visual patterns.
One object must be shown to the model in multiple ways
Defective items were subject to especially strict coverage requirements. Defects had to be photographed from multiple directions, including approximately vertical, 30°, and 60° views, with at least five viewpoints in total.
The reason is straightforward: the visible appearance of the same defect can change substantially with camera position. A surface defect that is obvious head-on may partly disappear, blend into texture, fall into shadow, change apparent shape, or resemble a normal feature when viewed from another angle.
Lighting is part of the data, not merely a shooting condition
The project explicitly defined several illumination regimes:
- Low illumination — approximately up to 500 lux, where shadow detail, contrast, and color fidelity may degrade.
- Normal illumination — approximately 500 lux and above, where the object and surface detail remain readable.
- Overexposure — around 10,000 lux and above, where local or strong highlights can destroy texture and color information.
The goal was not to intentionally create bad photos. The goal was to expose the model, before deployment, to conditions it could realistically encounter in production.
Even light color matters
External light temperature was also controlled:
| Condition | Color temperature |
|---|---|
| Warm light | 2700–3500 K |
| Neutral light | 4000–5000 K |
| Cool light | 5500–6500 K |
For ripeness estimation this is particularly important because product color may be one of the class signals. The same apple under cool and warm light is physically the same object, but the model receives somewhat different visual feature distributions.
What it really means to “cover a SKU”
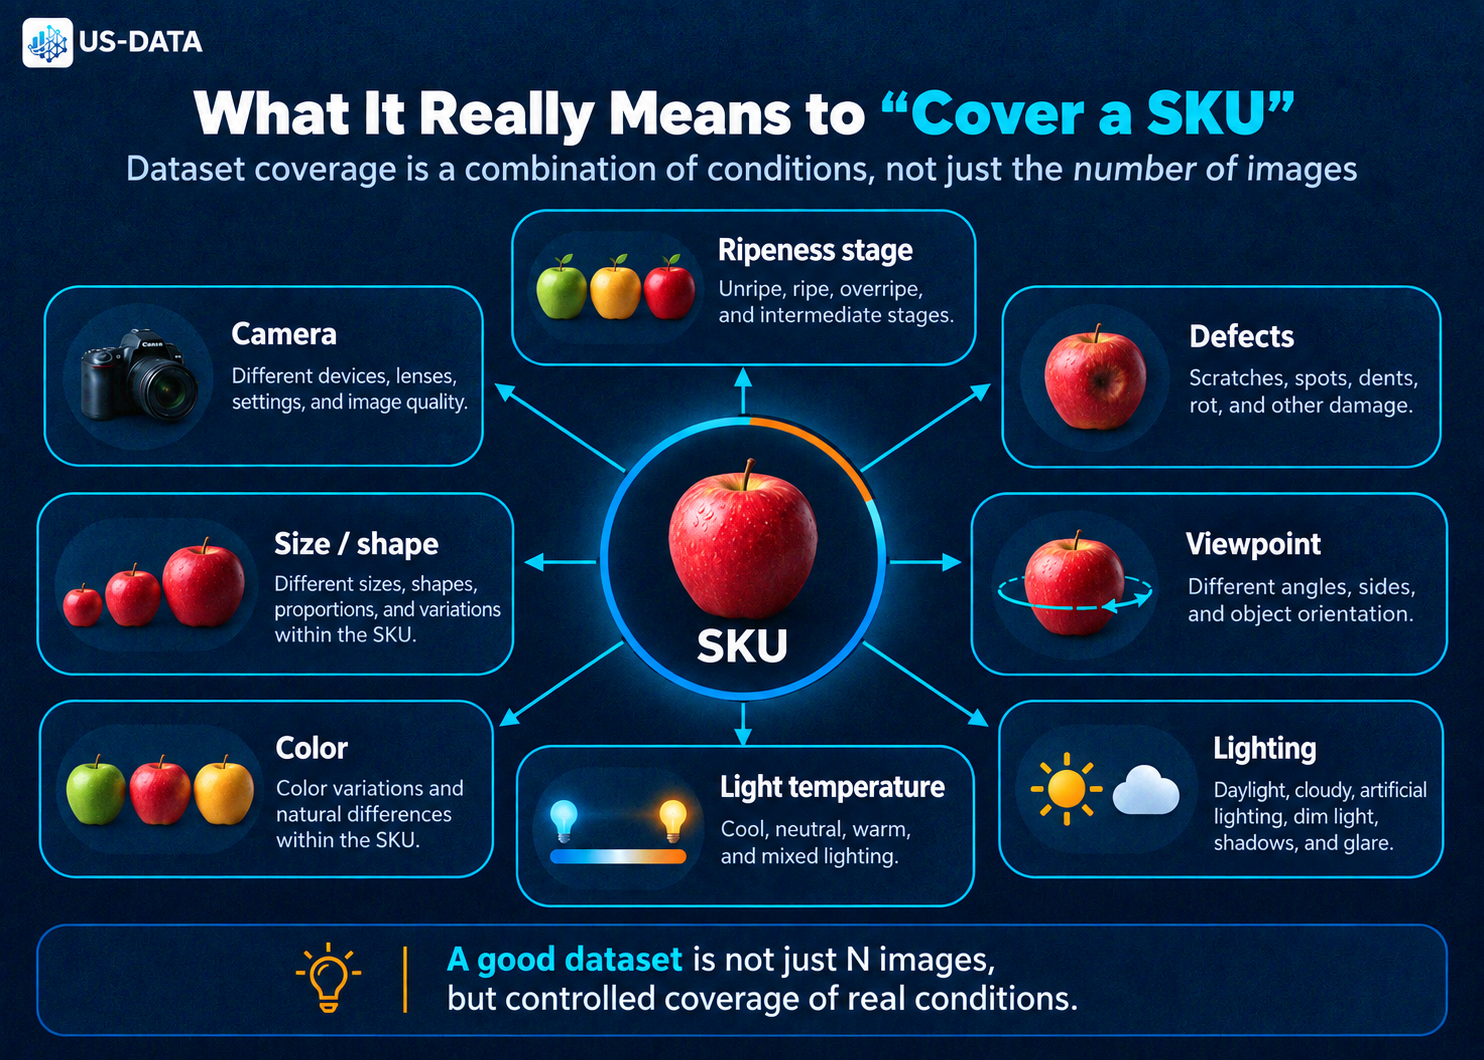
Coverage means controlling combinations of camera, size and shape, color, ripeness, defects, viewpoint, lighting, and light temperature. The more factors can affect model performance, the more important it is to ensure that these variants are present in training data.
Class balance must also be designed
Why a high overall metric can hide a serious problem
Consider a simplified dataset with 950 normal products and only 50 defective ones. A model that almost always predicts “normal” can still produce an impressive overall score while failing at the business-critical task of defect detection. Dataset quality therefore cannot be assessed by file count or by a single aggregate metric alone.
At minimum, the team should inspect class counts, within-class diversity, rare scenarios, and whether the minority cases that matter operationally are represented well enough.
Another common mistake is to collect data in whatever proportions are easiest to obtain. Availability and training value are not the same thing.
In this project, images were initially divided into two primary classes: 60% “for order fulfillment” and 40% “for write-off.” Where ripeness assessment applied, the “for order fulfillment” class was further split into less ripe, medium-ripe, and more ripe stages in approximately equal proportions.
This matters because a dataset dominated by normal products can still produce an impressive overall metric while failing at the rare-defect detection task the business actually cares about.
Train, validation, and test must be genuinely independent
The project used an 80/10/10 split. But a ratio alone does not guarantee valid evaluation. If ten nearly identical images of the same apple are distributed randomly across train and test, the test may measure recognition of an already-seen object rather than generalization to a new object.
Splits therefore need to account for image origin and relatedness, not just randomly divide file names.
Metadata turn a folder of images into a manageable dataset
For each image, the project required metadata fields:
- filename
- object_type
- ripeness_stage
- defect_type
- angle
- lighting_condition
- split
- light_temperature
These fields make it possible to ask useful questions: Is low light represented in test? Are some defects visible only from one angle? Is cool light concentrated almost entirely in train? Which defect type causes the most model errors? Without metadata, those questions require manual inspection of thousands of files.
Near and far cameras served different purposes
The project used two capture scenarios. A close RGB camera with at least 2 MP provided detailed product images, with the item occupying 60–90% of the frame and with good near-focus performance. A second, farther RGB-D camera was installed roughly 50 cm from the object.
The far camera had a different role: to capture data more similar to what the production setup would actually observe. A strong dataset should include not only convenient training images but also images that resemble the future production stream.
Object diversity is more valuable than many frames of the same object
Where the annotation team enters the process
Early involvement of annotators and QA helps expose semantic questions before tens of thousands of images are collected: where normal surface variation ends and a defect begins, how ripeness stages are separated, how multiple defects on one item should be handled, and what to do with partially visible damage.
For complex CV projects, data collection, annotation, QA, and ML requirements work better as an iterative loop than as isolated consecutive stages.
The requirements explicitly noted that there was no need to take a very large number of images of one physical unit. It is usually more useful to increase variation between instances within an SKU — different sizes, colors, shapes, surface textures, and defects — so that the model learns the class rather than memorizing a few objects.
Characteristic elements must also appear in both normal and defective examples. For an apple, a stem can easily become an accidental shortcut if it is systematically associated with only one class.
Main takeaway
A good dataset cannot be defined by a single number. One thousand, ten thousand, or one hundred thousand images do not guarantee robust performance. What matters is which objects, states, defects, viewpoints, lighting conditions, cameras, and rare cases are actually represented.
3. If Two Annotators See the Same Object Differently, the Problem May Be the Guideline
One of the most uncomfortable situations in annotation is when two people receive the same image and assign different labels. The immediate reaction is often that one of them must be wrong. In practice, the cause can be deeper.
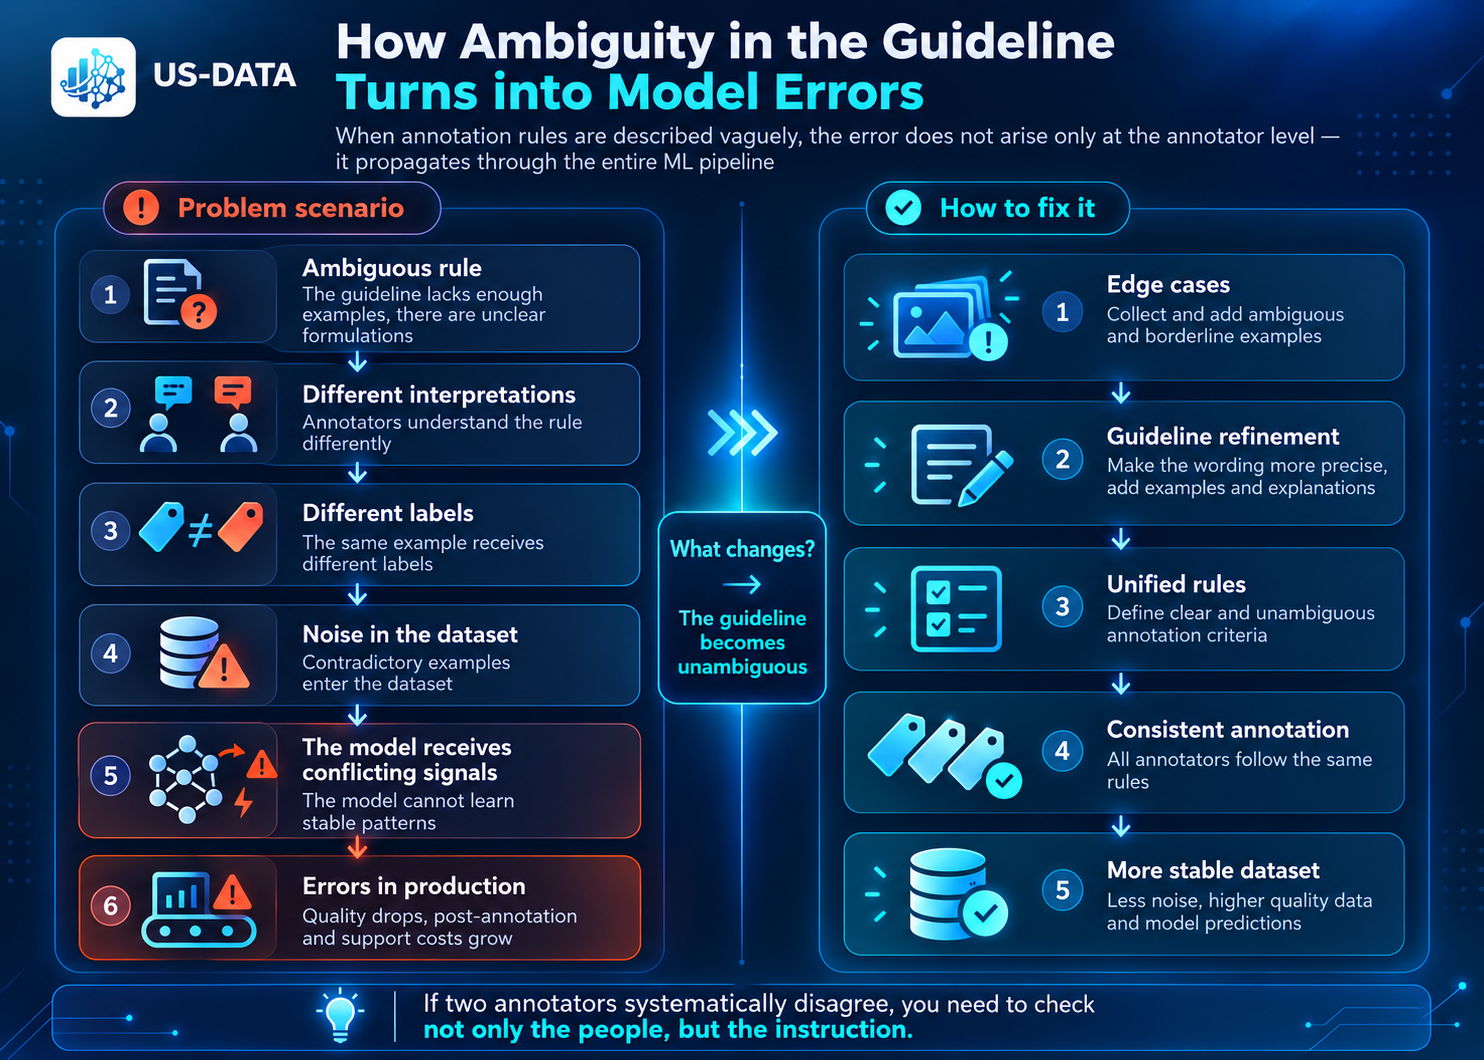
If the object is genuinely borderline, the instruction is incomplete, classes overlap, or a defect is defined too abstractly, both annotators may be acting logically — simply according to different interpretations. In that case, the problem is not individual quality; it is insufficient formalization.
A good guideline must answer more than “what to label”
- Where does the object begin and end?
- Where is the defect boundary?
- What counts as normal?
- How should partially visible elements be handled?
- How should mixed cases be interpreted?
- What if an object fits more than one class?
- Which cases should be escalated?
The more complex the visual task, the less useful a generic instruction such as “Label pizza defects” becomes. The project must define what a defect is, what it looks like, where its boundary lies, and how it differs from a similar but acceptable product state.
Real example: pizza annotation
In one US-DATA project, more than 100,000 images from a pizza chain had to be annotated. Different annotation types were used. Masks or polygons were required for elements such as the crust, backing, and cuts, while defects were annotated with bounding boxes.
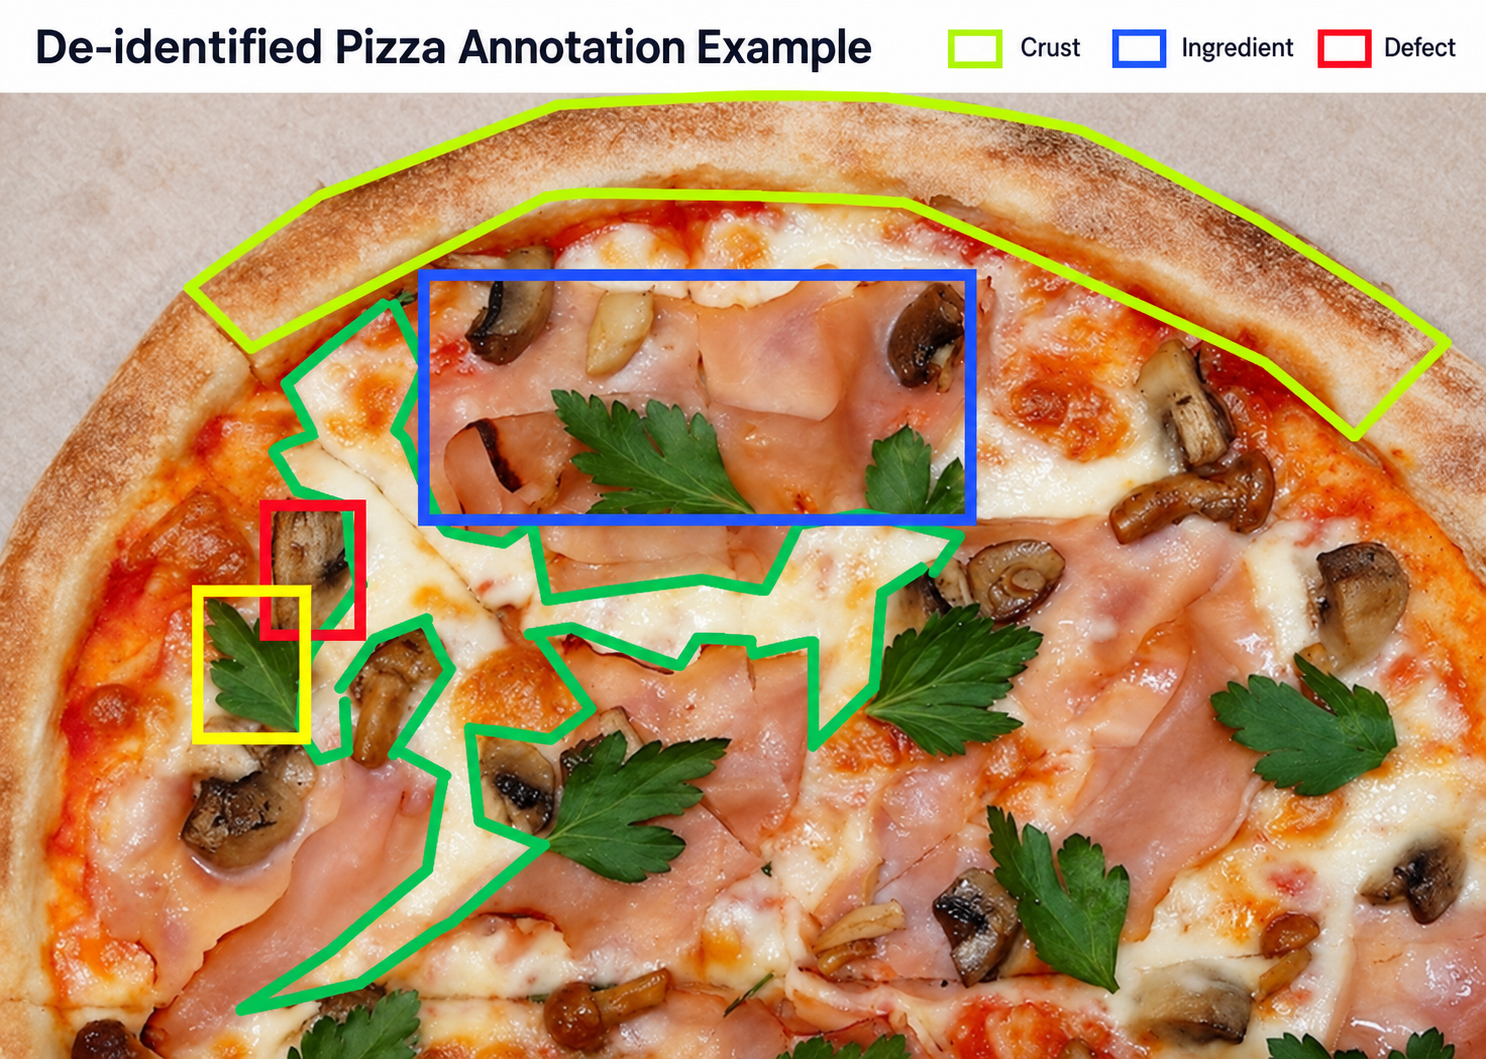
Questions appeared almost immediately. One requirement described a defect as “an area where the cheese has not fully melted.” In the source images, however, the exact boundary of that condition was not always obvious, so the team requested more examples.
A similar problem arose with the crust: some images showed dough that was twisted, while the same edge could also be overbaked. Was that a shape defect, a baking defect, or both? Such cases cannot be solved by telling annotators simply to “be more careful.” They require a new, more explicit rule.
Borderline cases are part of the task, not exceptions
What changed as the pizza project progressed
The project rules were refined through real questions from production annotation. Decisions such as whether to label toppings, how to treat foreign objects, and how to mark visible cuts were converted into explicit guideline updates rather than left in chat messages or individual memory.
If a guideline includes only one clear positive and one clear negative example, annotators have to invent the missing rule for intermediate states. At scale, those individual interpretations become systematic label noise.
As the pizza project progressed, the instructions were refined. For example, the team explicitly documented that cheese used as a topping should not be labeled as a separate object; a foreign object in the frame should be boxed but not classified; and a visible cut should be marked with a mask or polygon.
These may look like small details, but at the scale of tens of thousands of images they determine the uniformity of the ground truth and the reproducibility of annotation decisions.
Annotators should not have to guess
A strong guideline shifts the annotator’s role from interpreting the meaning of a class to applying a previously agreed rule. This becomes essential when tens or hundreds of annotators work on the same dataset.
Instead of a vague statement such as “the cheese is poorly melted,” the team should strive for a more operational rule: which visible patterns count, what area is affected, and how the condition differs from the normal state. Mathematical precision is not always possible, but reducing room for interpretation improves consistency.
Visual examples are often more useful than long text
For visual annotation, a good guideline should normally include at least four types of examples: an obvious positive case, an obvious negative case, a borderline case, and a case that must be escalated.
The pizza project showed that missing examples for individual defects were a direct source of clarification requests.
Human-in-the-loop for pizza
The goal is not to send the entire production stream to people. It is to reserve human attention for cases where a human decision creates new information for the model.
Simply increasing the number of annotators does not solve an ambiguous guideline. Ten, one hundred, or one thousand annotators will only scale contradictory labels if the rule itself is unclear. What must scale alongside workforce is the guideline, QA, feedback, escalation, version control, and the process for updating instructions.
Three signs that the specification needs revision
The most expensive scenario is discovering ambiguity late
If overlapping classes are discovered in a 500-image pilot, the rules can be corrected cheaply. Discovering the same ambiguity after 100,000 images may require locating affected records, reannotation, repeated QA, dataset rebuilds, and possibly retraining. Pilot annotation and early team calibration are therefore cost-control tools, not formalities.
- The same questions keep recurring. If independent annotators ask the same thing, the guideline is probably incomplete.
- QA repeatedly corrects the same type of error. The rule is likely unclear or poorly illustrated.
- Every discussion creates new exceptions. This often means the taxonomy or task formulation is still immature.
It is usually cheaper to pause scaling for a few hours or days and refine the rules than to rework tens of thousands of annotations later.
Main takeaway
When two annotators assign different labels, do not automatically assume that one is a bad performer. First verify whether the rule is unambiguous, whether visual examples exist, whether edge cases are covered, whether classes overlap, and whether there is a clear escalation path. High-quality annotation begins with one rule for one situation across the entire team.
4. Annotation Quality Control: What to Check Beyond “Right / Wrong”
Annotation review is often reduced to a binary decision: the object is labeled correctly or it is not. For an ML project, this is not enough. A dataset can look visually neat and still be poor training material because quality depends on completeness, consistency, balance, rule compliance, and coverage of difficult cases.
QA should therefore be designed as an ongoing process inside production annotation, not merely as a final inspection of the finished dataset.
Nine layers of QA
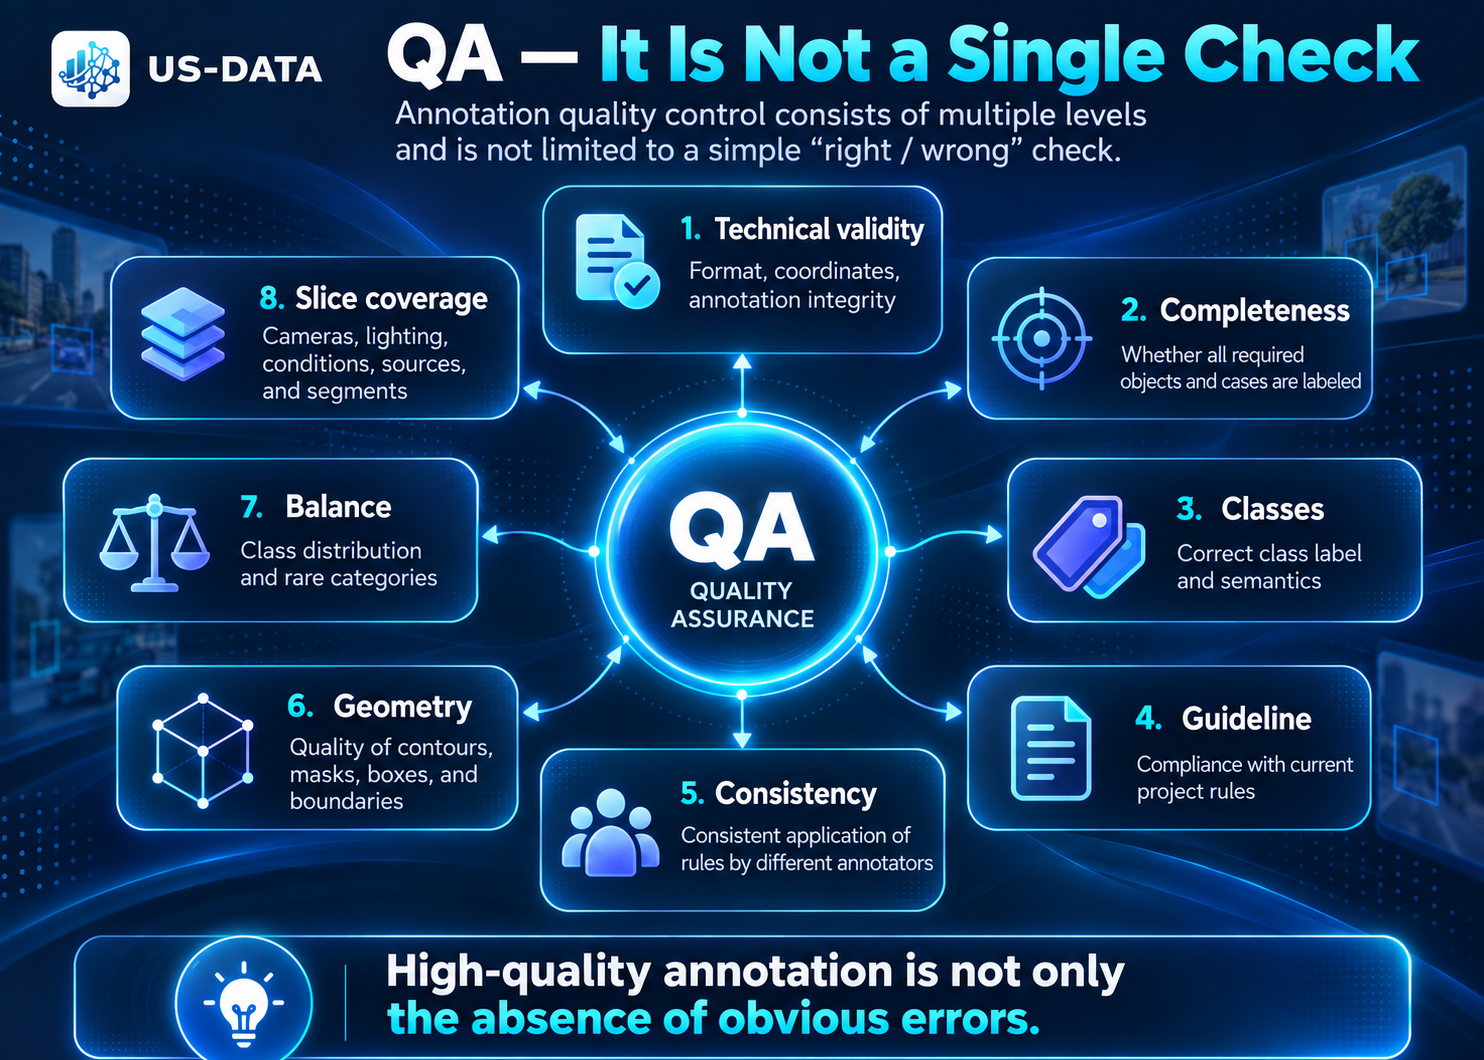
1. Technical validity
Check whether the annotation is structurally valid for the task: bounding boxes stay within the image, polygons are closed, masks are not broken, duplicate objects are avoided, coordinates are valid, class IDs exist, files match their images, and exports conform to the required format. Many of these checks can be automated.
2. Completeness
Missed rare objects are especially dangerous
Missing one object among thousands of common objects is not equivalent to missing the only rare defect in a dataset. QA effort should reflect class criticality: standard sampling for stable common classes, enhanced review for rare defects, double review for new classes, and expert review for disputed edge cases.
An annotation can be correct but incomplete. If an image contains five objects and only four are labeled, the unlabeled fifth object becomes a contradictory training signal. QA must ask not only whether what is labeled is correct, but whether everything that should be labeled has been found.
3. Class correctness
The cheese-versus-butter example illustrates the distinction between geometry QA and semantic QA: an object can be outlined correctly while the class label is wrong.
4. Guideline compliance
What if the rule changes halfway through the project?
When a guideline changes, teams need to know which data were produced under each version and which annotations may be affected. A narrow edge-case change may require rechecking only a subset; a change to a core class rule may require much broader review. This is why annotation QA and dataset versioning are tightly connected.
A label can be reasonable in general and still violate project-specific rules. One project may require a partially visible object to be labeled only when more than 50% is visible; another may label any visible part. The error begins when different parts of the dataset follow different rules.
5. Inter-annotator consistency
Periodically giving the same sample to multiple annotators helps identify where the rule is unstable. Concentrated disagreement may indicate an unclear class, weak examples, ambiguous boundaries, inadequate training, or a task that is inherently subjective.
6. Geometry consistency
For segmentation and polygon tasks, annotators must apply boundary rules consistently: how tightly to follow contours, whether to include small protrusions, how to treat shadows, transparent parts, and occlusions.
7. Class balance
Dataset-level QA must inspect the class distribution and rare categories. A perfectly labeled dataset can still be inadequate if one critical class has only a handful of examples.
8. Slice coverage
Overall quality may hide weak segments. Day versus night, camera A versus camera B, old packaging versus new packaging, or one region versus another may have very different performance. Metadata are what make such slice-level QA possible.
9. Golden set
Large projects benefit from a small reference dataset with pre-agreed labels, difficult cases, and expert decisions. A golden set can be used to train new annotators, monitor current teams, calibrate QA, and verify behavior after a guideline change.
QA should run during the project, not after it
One of the most expensive mistakes is to annotate the full volume and only then begin validation. A safer process starts with a pilot batch — for example, around 500 images — updates the rules, grows to several thousand, and only then scales further. The purpose is to detect systematic errors before they become tens of thousands of wrong annotations.
A multi-level QA workflow
- Annotator — performs annotation.
- Automated validation — checks formats, coordinates, class IDs, missing files, and empty annotations.
- Reviewer — validates a sample or the full volume for high-risk classes.
- Senior QA — resolves difficult and disputed cases.
- Domain expert — decides semantically difficult questions.
- Dataset-level validation — checks the structure and coverage of the entire dataset.
Not every part of the dataset needs the same depth of review
QA must create a feedback loop
If a reviewer silently fixes annotations, the same error will recur. A mature QA process identifies the reason, updates the rule when necessary, gives feedback to the team, and rechecks the affected segment. “The annotator made a mistake” is much less useful than “the guideline does not define how to treat an object with more than 50% occlusion.”
Risk-based QA allocates review effort according to the importance and uncertainty of the data. Simple images may be sampled; a new annotator may receive a higher QA rate; a new class or rare defect may receive nearly complete review; edge cases may require an expert.
QA must also create feedback. If a reviewer only fixes an annotation but the cause is never communicated, the same error will recur. A mature process classifies the reason, updates the rule when necessary, informs the team, and rechecks the affected segment.
Checklist before handing a dataset to ML
The most important QA question
Do not ask only “What percentage of annotations did we check?” Ask “Which errors could still pass through, and how dangerous would they be for the model?”
For production ML, 99% correctness on easy objects can matter less than errors in the 1% of rare, business-critical cases. Mature QA is therefore risk management, not simply a count of corrected labels.
Main takeaway
Annotation quality should be reviewed at four levels: annotation-level correctness, consistency of rule application, dataset-level coverage and balance, and production-level representativeness. The earlier these checks are embedded in the workflow, the less likely a defect is to reach model training or deployment.
- Files: all images are accessible; no broken files; filenames are unique.
- Annotations: no missing required classes; coordinates are valid; masks/polygons are structurally correct; class IDs match the taxonomy.
- Semantics: the current guideline is followed; borderline cases are resolved; disputed examples passed QA.
- Dataset: class distribution is expected; rare categories are preserved; train/validation/test are separated correctly; there is no obvious leakage.
- Metadata: required fields are filled; categories are standardized; missing values are understandable.
The key QA question is not “What percentage of annotations did we inspect?” but “Which errors could we still miss, and how dangerous would they be for the model?”
5. How to Fix an Already Annotated Dataset Without Starting Over
Finding defects in an already annotated dataset does not automatically mean that the entire collection must be rebuilt. In engineering practice, the first step is to determine how local the problem is, where it came from, and how strongly it affects the model. Then the team chooses the minimum corrective scope.
A common management mistake is to discover label noise or inconsistent classes and conclude that the whole dataset is “ruined.” In practice, it is often better to locate the problematic segment, identify the root cause, and correct only that part.
Step 1. Locate the problematic slice
First determine the scale of the problem
The first question is whether the error is local or systemic. Confusion between two similar classes, failures limited to a new package, or data produced under one obsolete guideline version can often be corrected without touching the rest of the dataset. If the class logic itself was wrong from the beginning, the rework scope may be much larger.
- A specific class or pair of similar classes
- A particular defect
- One camera or source
- One time period
- A new packaging design
- A specific annotator or team
- One guideline version
- A production scenario
Instead of saying “Our dataset is bad,” the team should aim for a precise statement such as: “Classes A and B are inconsistent in images collected after this change.”
Step 2. Connect model errors to the data
The model itself is often the best source of information about dataset weaknesses. In the retail case, the client observed discrepancies between AI output and checkout sales, manually inspected problematic videos, and sent difficult examples for reannotation. That is much more efficient than randomly reviewing the entire archive.
Do not fix what already works
Imagine a dataset with 200,000 images. The problem is concentrated in two similar categories totaling 12,000 images, and only about 2,000 are genuinely ambiguous. A reasonable strategy is to filter the 12,000 relevant items, identify the 2,000 highest-risk cases, reannotate them, and strengthen the segment with new hard cases. This is a risk-based reannotation approach.
Step 3. Fix the rule, not only the labels
If the team corrects annotations without correcting the cause, the same error will return. A mass correction should always ask why the errors occurred: poor guideline, overlapping classes, missing examples, a new product version, weak QA, an incorrect taxonomy, or an ambiguous defect.
Step 4. Create a new dataset version
A corrected dataset should not be stored as dataset_final_final2_new.zip. The project needs explicit versioning:
- Dataset v1.0 — original version
- Dataset v1.1 — labels corrected for two classes
- Dataset v1.2 — hard cases added
- Dataset v2.0 — taxonomy changed
This makes it possible to determine which dataset produced a model, what changed, what improved quality, and whether a previous experiment can be reproduced.
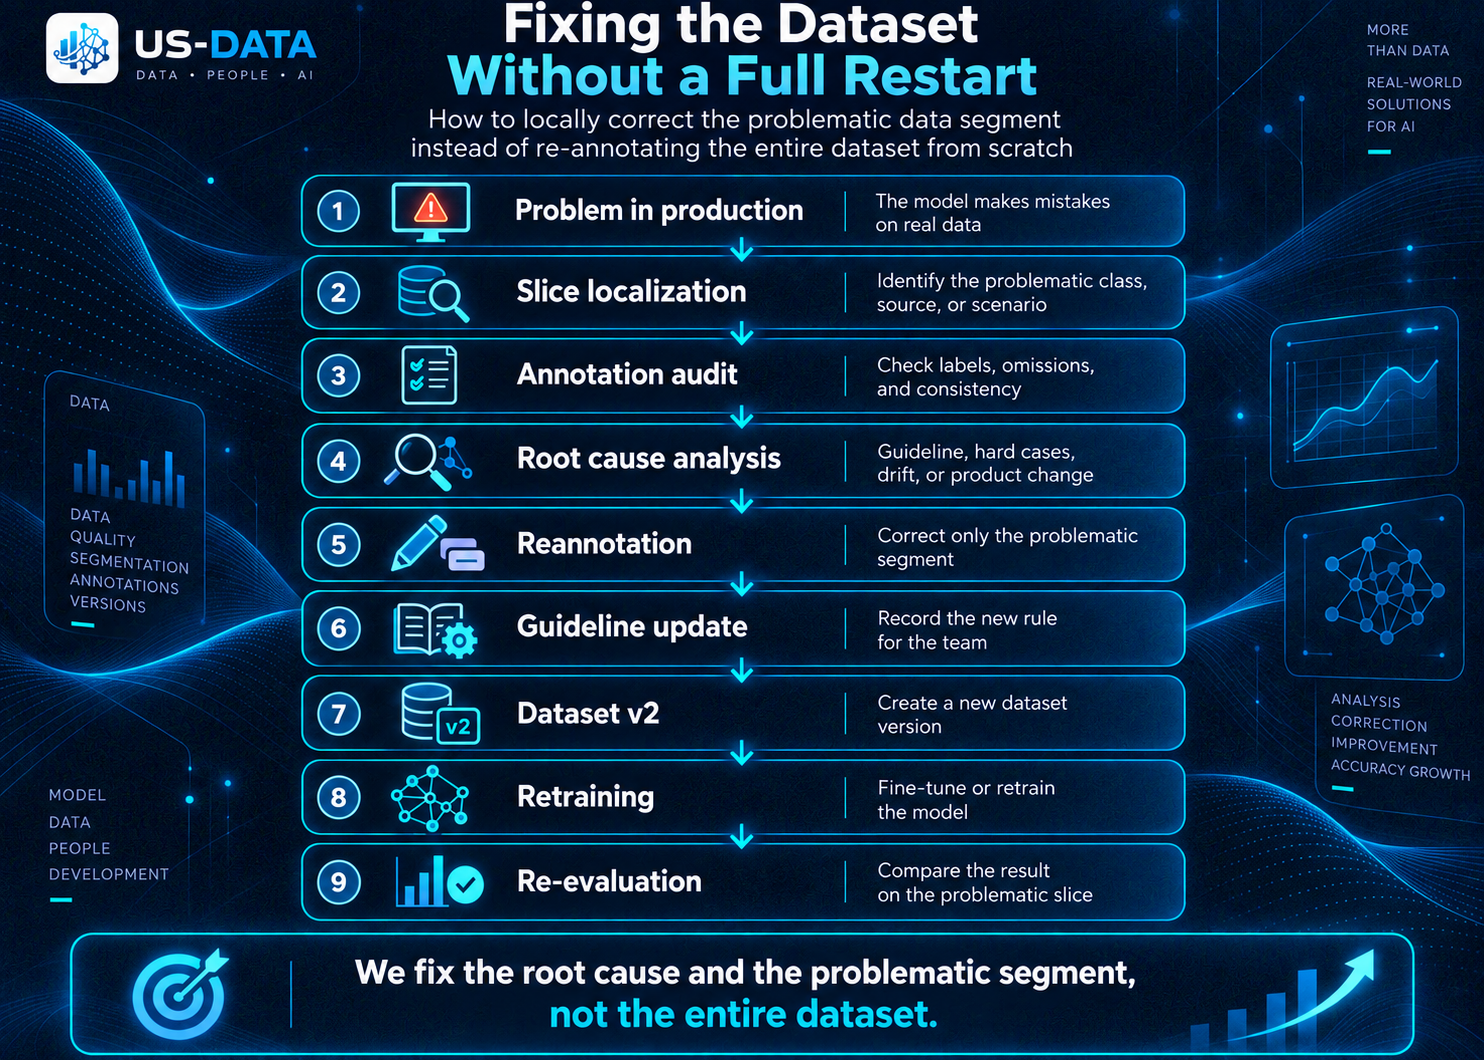
Step 5. Add hard cases
Why hard cases are more valuable than random expansion
If the model confuses two visually similar products, another 10,000 easy images may have almost no effect. A smaller set of examples where the distinction is genuinely difficult is usually more valuable because it increases the density of information near the model’s decision boundary.
Fixing old errors is only half the job. Once a model has shown where it struggles, those examples should become a dedicated data source: unusual viewpoints, new packaging, rare defects, partial occlusion, poor lighting, or visually similar neighboring classes.
Instead of adding another 10,000 easy images, adding 500–1,000 genuinely ambiguous examples may produce a much larger effect. The objective is to increase information density, not just file count.
Step 6. Check whether production itself has changed
A good dataset does not have to remain valid forever
A production dataset should be treated as a versioned asset with a limited period of relevance, not as an immutable archive. Retail, manufacturing, video analytics, and other real-world systems change over time; the dataset has to evolve with them.
Can the dataset be fixed without retraining the model?
Sometimes the immediate objective is only to prepare the next dataset version, so model retraining can wait. But when meaningful labels are corrected or new hard cases are added, the production model normally needs fine-tuning or retraining for those changes to affect predictions.
Sometimes the old dataset is not wrong; the environment has simply shifted. A new camera, different lighting, new packaging, a changed background, different product appearance, or a new geography can make the previous dataset less representative.
In that case, the right response is not to “repair” historical labels but to collect an updated layer of data.
How to know when reannotation is complete
Not all errors have the same risk
Rework can be prioritized by impact. Wrong class labels, missed objects, systematic confusion between classes, and train/test leakage are typically critical. Minor geometry deviations, incomplete metadata, or occasional guideline violations may be medium risk. Cosmetic differences that do not affect model behavior can be low priority.
What to do with old data after a guideline change
A guideline update does not automatically require reannotation of the entire dataset. Use metadata and version history to identify the affected cases — for example, only occlusions, only a specific defect class, or only images collected after a certain date.
- The problematic error pattern has disappeared or materially decreased.
- The relevant slice metrics have improved.
- Other classes have not regressed.
- No new systematic errors have appeared.
- Quality remains stable on production-like data.
The improvement may be small in the aggregate while large in the important class. For example, a global metric may move from 97% to 97.4%, while the critical slice improves from 72% to 94%.
When starting over is justified
Summary
A problematic dataset is not necessarily a failed asset. The efficient sequence is to localize the error, identify its cause, correct the relevant annotations and rules, release a new version, retrain when needed, and validate again. The better the team understands where and why the model fails, the smaller the rework scope can be.
A full reannotation may be reasonable when the taxonomy has changed fundamentally, most classes overlap, the original guideline was conceptually wrong, image-to-annotation links are lost, provenance is missing, or it is impossible to determine which rules were used for different parts of the dataset. These are exceptional cases, not the default.
6. Data Drift: Why the Model Worked Yesterday and Fails Today
Sometimes the team does everything correctly: the dataset is collected carefully, annotations are reviewed, the model performs well on train, validation, and test, and the pilot succeeds. Then, a few months later, quality begins to decline even though the model code has not changed.
In applied terms, data drift is a change in the input data distribution relative to the data on which the model was trained and validated. The model can stay the same while its historical quality estimate becomes less representative of the current production environment.
The model is still operating according to the old world, while the world itself has changed.
A retail example: packaging drift
Data drift does not mean the model “went bad”
The model may still perform exactly as before on data similar to its training distribution. The problem appears when the live stream moves away from that distribution. The algorithm may be unchanged while its previous offline quality estimate no longer describes current production.
In the grocery-retail project, packaging changed frequently — in some months between 3 and 25 design updates. For the customer, redesigned cheese is still cheese. For the model, the color, logo, product image, typography, shape, contrast, background, and decorative elements may all be different.
The client detected this through discrepancies between AI output and actual checkout sales. New packaging could trigger more errors, followed by manual review, hard-case selection, targeted annotation, retraining, and another deployment cycle.
Different forms of drift
- Object appearance changes — new packaging, color, shape, supplier, or design.
- Capture conditions change — camera, lens, resolution, exposure, or lighting.
- Object composition changes — new SKUs appear, class distribution shifts, rare classes become common, or some products disappear.
- The business process changes — cameras move, staff interaction changes, layouts change, or the object follows a different route through the system.
Data drift and concept drift are not the same
Data drift means the inputs have changed. Concept drift means the relationship between inputs and the correct answer has changed. A packaging redesign is data drift. A business rule that reclassifies a previously acceptable condition as a defect is concept drift.
For annotation teams, the distinction matters. Data drift may require new examples and retraining. Concept drift may require changes to the taxonomy, guideline, and historical labels.
Why the old test set does not protect you
A test set answers how the model performs on a predefined evaluation sample. If production changes, the test set may continue to represent the old world. A model can still score extremely well on a 2025 test set while 2026 packaging looks substantially different.
This is why evaluation data must evolve together with production.
What to monitor after deployment
In the retail project, sales acted as a drift signal
The team did not rely on ML metrics alone. AI-detected product events were compared with checkout sales. Growing disagreement became a trigger for manual review, targeted annotation, and the next training iteration. Business data can therefore be a practical drift detector.
Time-based slices matter
Compare January versus March, old camera versus new camera, before versus after a redesign, daytime versus evening, or SKU version 1 versus version 2. Time and version slices help locate when the input distribution started changing.
- New or changed classes
- Class-distribution shifts
- Growth in low-confidence predictions
- More manual corrections
- New error types
- Camera or lighting changes
- New SKUs
- Increasing divergence from business metrics
Drift rarely happens all at once. A product changes today, another next week, then a camera is replaced, then lighting changes. Each event may be small, but together they gradually move production away from the original training distribution.
From batch annotation to continuous annotation
Not every drift event requires immediate retraining
Some changes are harmless. A slightly different background may not affect quality at all. First measure the effect. If degradation is confirmed, collect current examples, annotate them, and include them in the next training cycle.
Some changes are critical
New classes, new defect types, major camera changes, complete packaging redesigns, changes in business rules, and conditions that never appeared in training can create systemic failures quickly.
Where annotation fits into drift management
After deployment, annotation shifts from “label 100,000 images once” to “regularly identify new difficult cases and turn them into verified training data.”
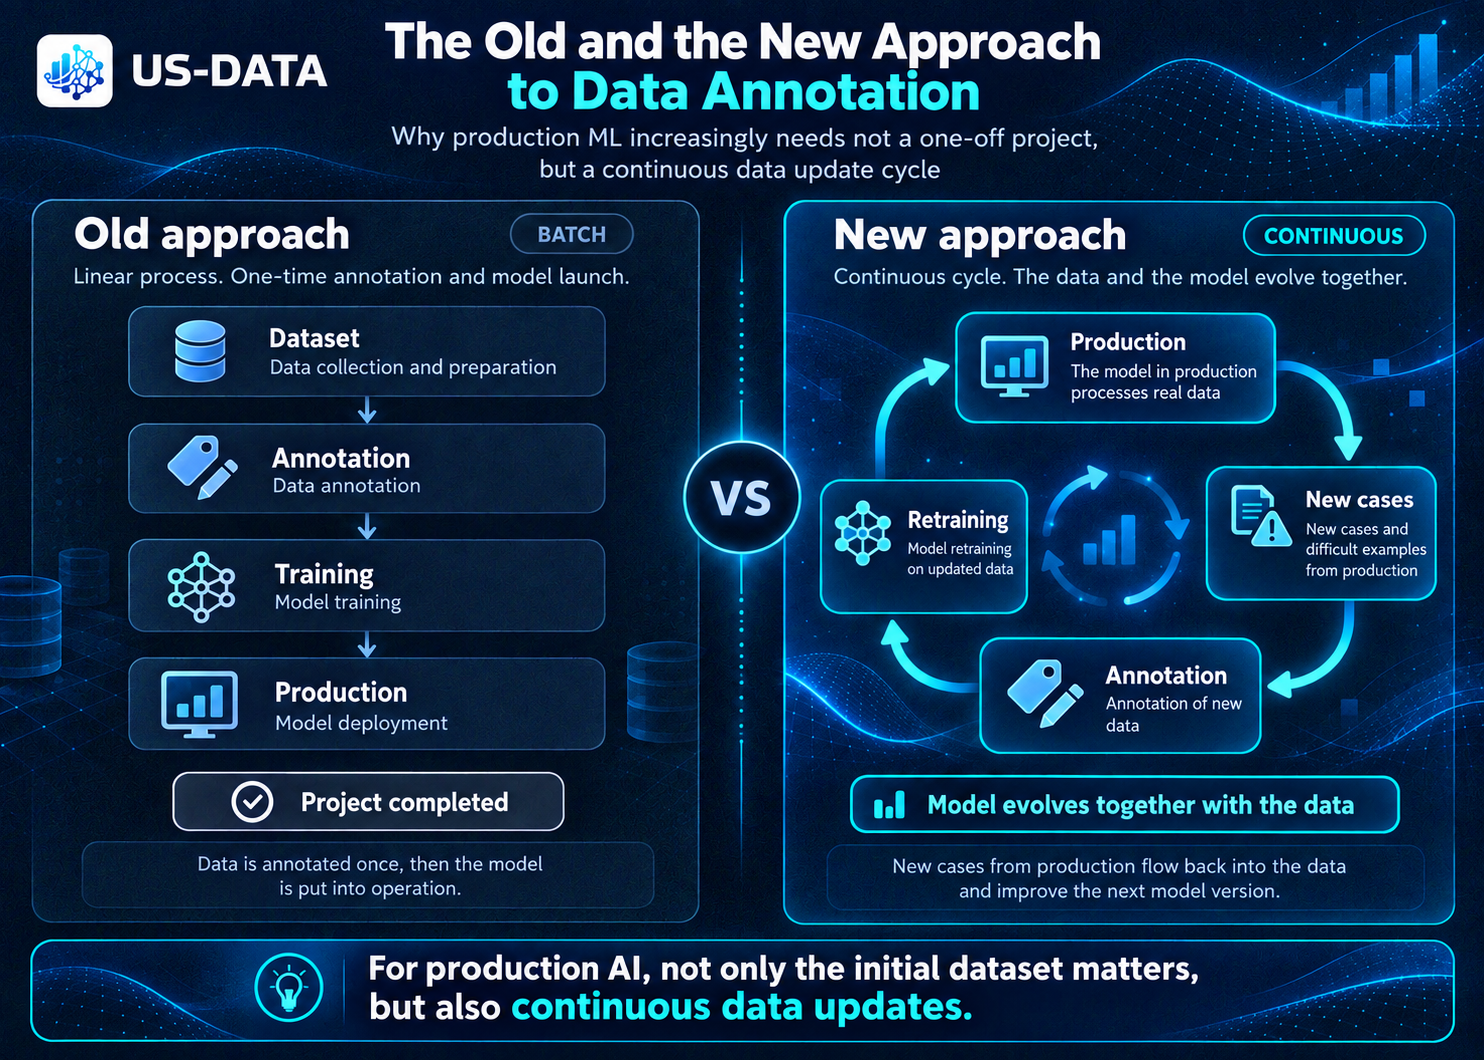
For production ML, annotation increasingly becomes continuous. New errors are selected, reviewed, annotated, incorporated into the dataset, used for retraining, and evaluated again in production.
The principle extends beyond computer vision. In NLP, user language and terminology evolve. In audio, microphones, acoustics, noise, and accents change. In recommender systems, audience behavior shifts. In fraud detection, attack patterns evolve.
When should the dataset be updated?
Who owns drift?
Drift is not only an ML-engineering responsibility. The first signal may come from business metrics, support teams, QA, annotators, data teams, operators, or users. Mature production systems combine those signals instead of keeping them in separate silos.
Main takeaway
A good dataset does not remain current forever. A mature ML lifecycle detects change, finds new hard cases, updates the dataset, retrains the model, and revalidates in production.
- One class begins to fail more often.
- Low-confidence cases increase.
- New SKUs appear.
- Packaging changes.
- Cameras or lighting change.
- Business rules change.
- New defect types appear.
- Manual moderation grows.
- Production metrics diverge from offline test results.
A good dataset is not permanently “finished.” A mature ML system detects change, finds new hard cases, updates the dataset, retrains the model, and validates again in production.
7. Hard Cases: Which Examples Improve the Model the Most
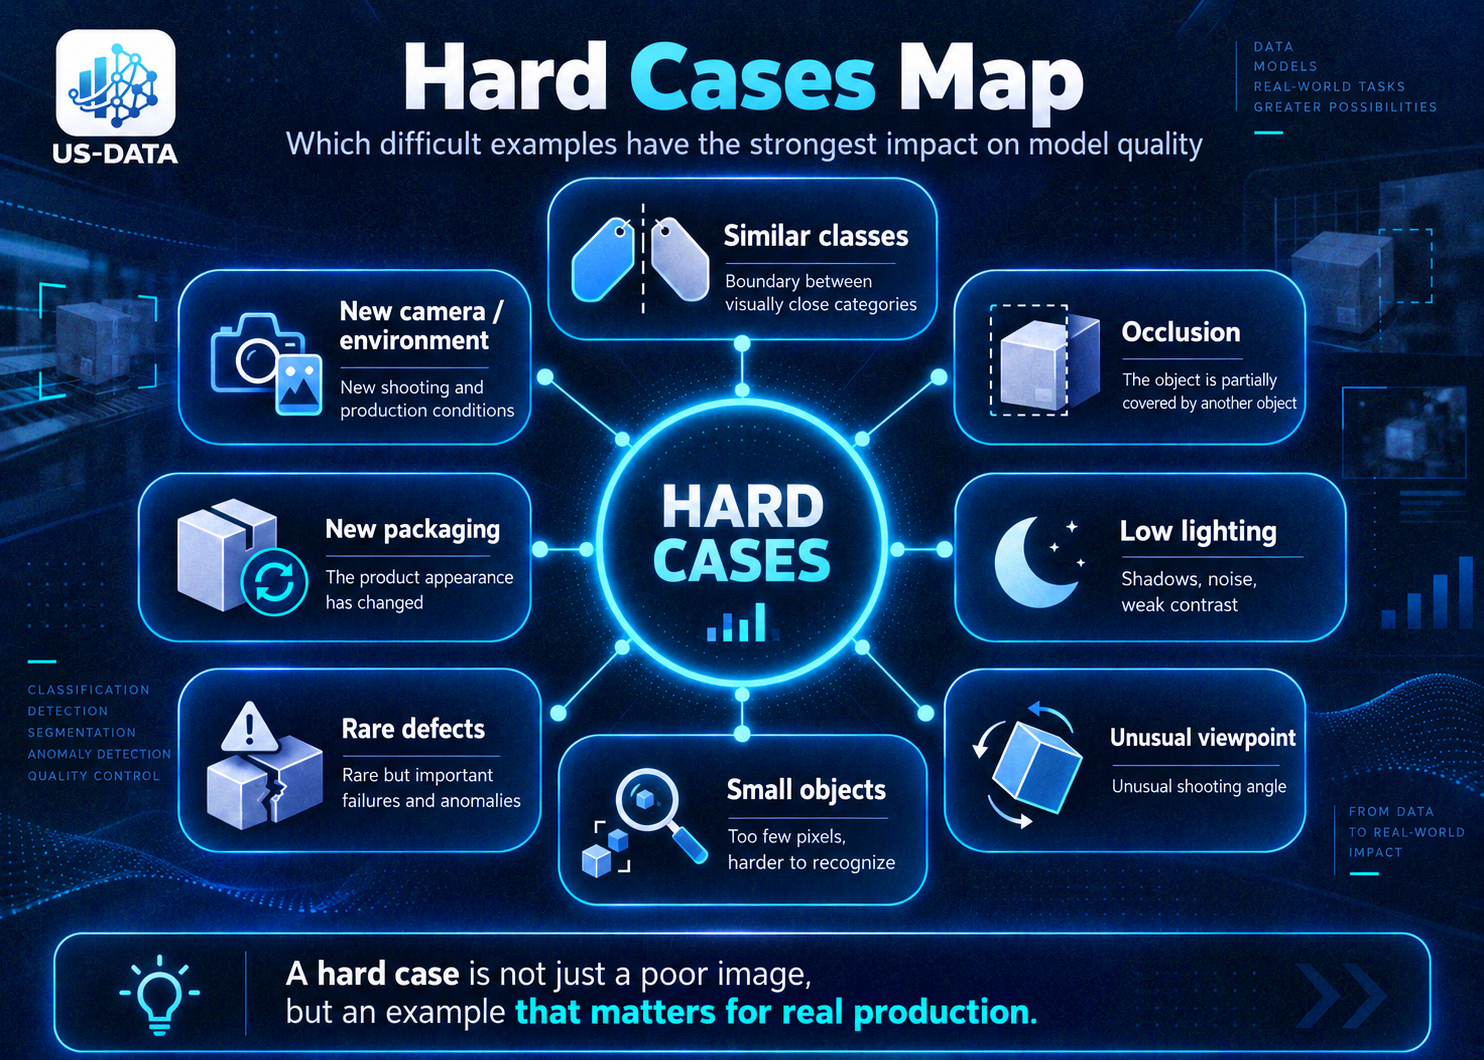
Once a model reaches acceptable quality, further improvement rarely comes from simply increasing data volume. Another 50,000 typical images may add little. It is often more valuable to find examples where the model already fails, hesitates, or behaves inconsistently.
A hard case is an example that carries more new information for the model than another ordinary example.
What makes an example difficult?
- Low lighting or glare
- Motion blur
- Occlusion
- Unusual viewpoint
- Partially visible objects
- Small objects
- Visually similar classes
- Rare defects
- New packaging
- Unusual backgrounds
- New equipment
- Combinations of several difficult factors
The same object can be easy in one frame and difficult in another. Cheese on a clean background under good lighting is simple. The same cheese partly covered by a hand, viewed at an angle, and visually similar to butter packaging is a hard case.
Why hard cases are more valuable than random sampling
If a model already classifies 99% of typical images correctly, another thousand near-duplicates mostly reinforce a pattern it already knows. A few hundred examples near the class boundary can be far more informative.
The issue is often not that the dataset is small overall, but that it is sparse in the part of feature space where the model makes mistakes.
Where to find hard cases
Production is often the best source of hard cases
In the retail project, hard cases were found through disagreement between AI output and actual sales. After manual confirmation, those errors became priority examples for reannotation and the next training iteration.
- Model errors — false positives, false negatives, class confusion, segmentation errors, and missed objects.
- Low-confidence predictions — especially when two candidate classes have similar scores.
- Disagreement with business data — sales, inventory, manual inspections, CRM, production measurements, or operator decisions.
- Human moderation — examples the system already routes to a person because the model is uncertain.
This is the basis of active learning
Instead of sampling data uniformly at random, active learning prioritizes examples that are likely to add information: uncertain samples, rare classes, new clusters, outliers, errors, and boundary cases. Annotation budget is concentrated where each new label can have more value.
Not every uncertain example is useful
Group hard cases instead of keeping one chaotic folder
Useful categories include similar classes, low light, occlusion, new packaging, rare defects, small objects, motion blur, and new cameras. Grouping makes it possible to see which problem is most frequent and to solve it systematically.
Low confidence can also be caused by an irrelevant or unusable frame: severe blur, corrupted input, the wrong source, or an object outside the task. Hard-case mining therefore needs a filter: does this example represent a condition the model must handle in the future, or is it merely noise?
How to prioritize hard cases
How to tell whether a hard case is truly useful
A high-value hard case usually satisfies three conditions: the model is unstable on it, the scenario actually occurs in production, and the error has a cost. Low confidence alone is not enough.
A useful hard case tends to satisfy three criteria: the model is unstable on it, the case actually occurs in production, and the error has a cost for the business, safety, reporting, or manual operations.
Hard cases can then be prioritized: frequent and critical errors first; rare but expensive errors with expert review; frequent but low-impact issues for automation; rare and low-impact issues with low priority.
Hard cases also reveal guideline defects
A model may confuse two classes, and review may reveal that annotators also interpret the boundary differently. Then the problem is not only the model. The team should refine the guideline, review affected labels, add reference examples, and retrain only on the agreed version of the data.
In the pizza project, difficult images were repeatedly returned to manual annotation and the updated dataset. Iterations continued until the project reached roughly 97% according to its project metric. The important point is not the number itself but the mechanism: production errors were systematically turned into new training data.
Turn model errors into an annotation queue
The pizza project used hard cases as part of a continuous loop
Images the model could not classify confidently were routed to human moderation, returned to manual annotation, and then fed back into the dataset. Iterations continued until the project reached roughly 97% on its project metric. The key point is the feedback mechanism, not the number itself.
Duplicates are especially expensive
If one difficult video event appears in hundreds of adjacent frames, labeling all of them wastes annotation budget. Near-duplicate removal, clustering, and representative sampling preserve diversity.
Collect diversity inside the error
If the model fails on a new package design, do not collect only one item in one pose. Cover different instances, cameras, angles, lighting conditions, and neighboring objects inside the same failure mode.
Where a hard case ends and out-of-distribution begins
If a production input belongs outside the task taxonomy altogether, it may be better treated as an out-of-distribution sample. The correct response may be to add a new class, route it to “unknown,” exclude it, or change the business logic.
Hard cases are the bridge between production and data
The most valuable source for the next dataset version is often not the original archive but the current model’s errors.
Practical hard-case mining checklist
- false positives and false negatives
- low-confidence predictions
- confusion between similar classes
- new categories, packages, and cameras
- manual-moderation cases
- disagreement with business data
- rare but critical errors
A mature pipeline can filter inference results, remove duplicates and irrelevant cases, cluster similar failures, select representative samples, send them through annotation and QA, and feed them into the next training iteration.
Duplicates are particularly costly. If the same difficult event appears in 500 adjacent video frames, labeling every frame wastes budget. Near-duplicate removal and representative sampling keep the hard-case pool diverse.
Main takeaway
For a mature model, quality improves not through endless dataset growth but through better-selected data. The question “How many more images do we need?” is often less useful than “Which examples does the model understand worst right now?”
8. Who Owns Data Quality: ML, QA, Annotators, and Domain Experts
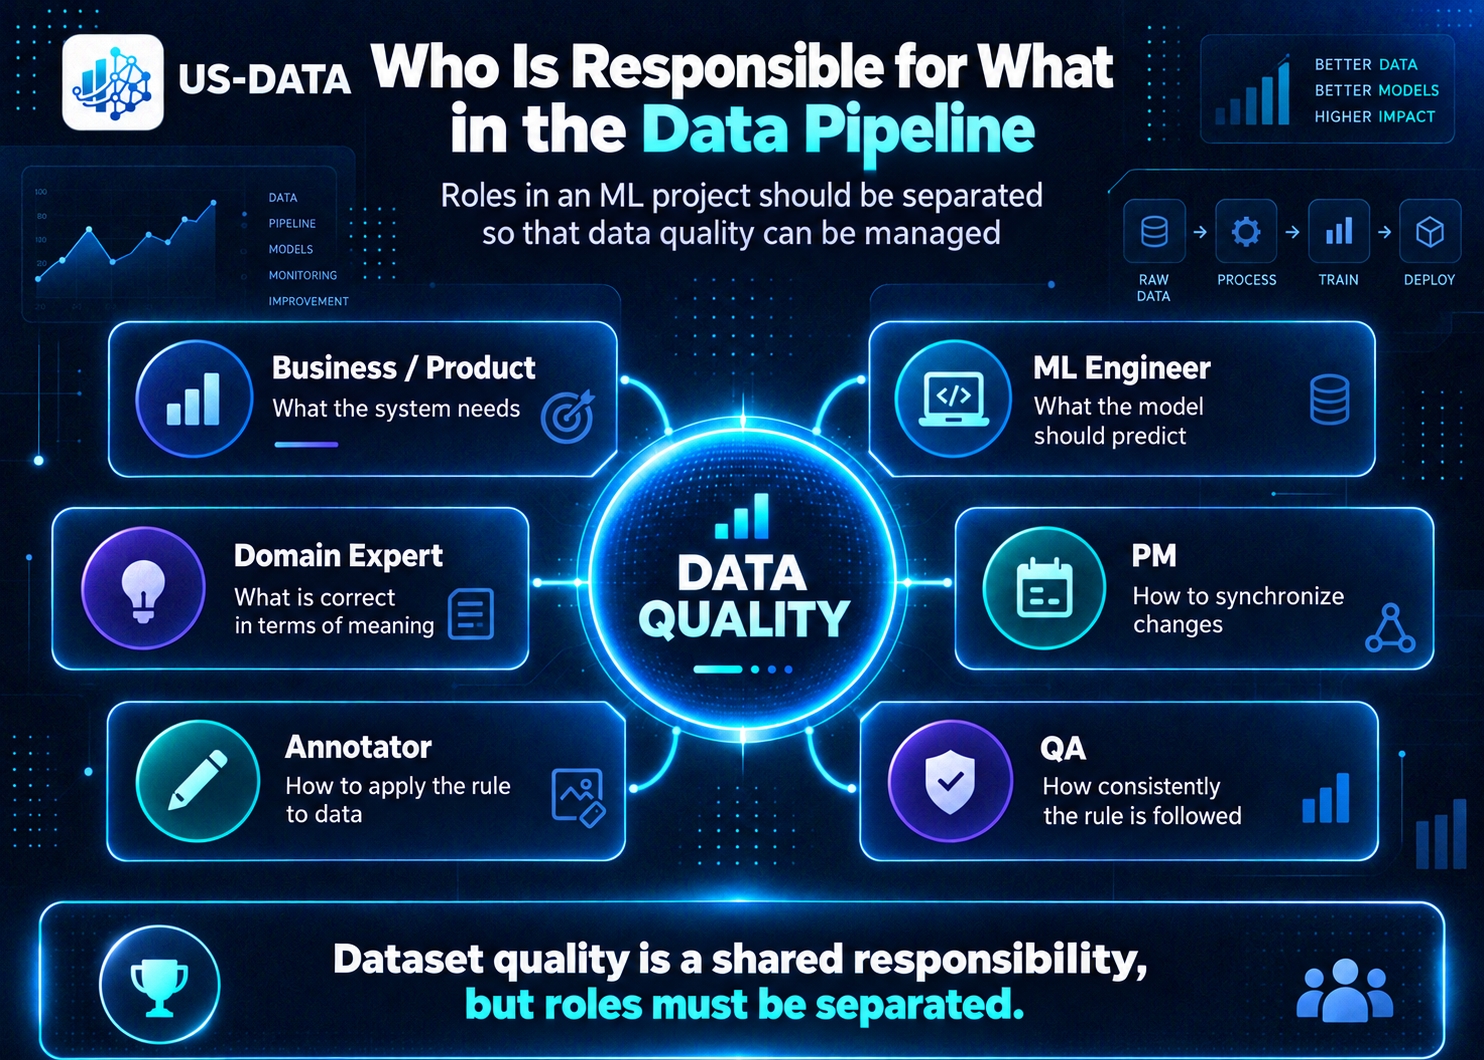
When a model fails, teams often look for one responsible party: the annotator used the wrong label, QA missed it, the ML engineer chose the wrong architecture, or the client did not explain the task well enough. In a real ML project, however, dataset quality rarely belongs to a single person or team.
It emerges at the intersection of business, ML, domain expertise, project management, annotation, QA, and production. The useful question is not “Who is to blame?” but “At which stage should this decision have been made, and who owns that type of decision?”
Annotators should not define the meaning of a class
Annotators should follow the guideline, apply approved classes, respect geometry rules, recognize ambiguity, and escalate disputed cases. They should not independently decide what the business considers a defect.
The pizza project made this visible: where exactly cheese counts as insufficiently melted, whether an overbaked edge is the same defect as deformed crust, whether a foreign object should be labeled, and whether ingredients need separate annotation are task-definition questions, not merely questions of annotator attentiveness.
The ML team defines what the model must learn
The ML team must return model errors back into the data workflow
After training, the ML team should surface confusion pairs, weak recall on rare objects, failures limited to specific conditions, and growth in low-confidence predictions. Those signals must flow back to the annotation/data team.
ML engineers or data scientists need to understand the required prediction, which classes are visually distinguishable, the necessary annotation granularity, which errors are critical, which metric the project optimizes, and what data are needed for training and evaluation.
If twenty defect classes are technically defined but humans cannot distinguish them reliably in the available imagery, scaling annotation will not solve the problem.
The domain expert owns semantic correctness
Sometimes the expert is needed for only a small fraction of the data
Clear examples can be processed by standard annotation, a smaller difficult subset by Senior QA, and only the most ambiguous cases by the domain expert. This keeps expensive expert time focused where it adds the most value.
A domain expert may be a production technologist, physician, merchandiser, equipment operator, quality specialist, or a client employee who understands the real business process. This person does not own polygon format or COCO export. They own the meaning: whether an item is truly defective, whether a ripeness stage is acceptable, whether damage requires write-off, and whether two categories must be distinguished.
Not every image needs domain-expert review. Clear cases can remain in standard annotation, a smaller percentage of difficult cases can go to Senior QA, and only the most ambiguous examples need domain-expert attention.
QA should stabilize the system, not merely correct annotators
A good reviewer looks for recurring error types, their causes, unclear rules, annotators who need recalibration, classes that require stronger control, and places where the guideline should change.
If ten different annotators independently make the same mistake, the problem is probably not ten people. The rule itself may be weak. The job of QA is then to eliminate the source of the next thousand errors, not merely repair the ten existing ones.
The PM connects the process
Who should change the guideline?
Guideline changes should follow a short approval loop: annotator or QA identifies a disputed case; PM routes it; ML, domain expert, or the client makes the semantic decision; the guideline is updated; and the whole team is notified. If the change affects existing data, the team also decides whether historical annotations need review.
In large annotation projects, the PM is not only responsible for deadlines. The PM becomes the center of information flow: requirement changes, new guideline versions, annotator questions, client answers, QA results, taxonomy changes, and new ML priorities.
Important decisions should move from chat messages into the current guideline, the change history, and team communication.
A strong process separates decision layers
Why one person should not perform every role
An annotator who labels, interprets ambiguous rules, resolves disputes, and reviews their own work can apply one misunderstanding very consistently across thousands of items. Independent control layers reduce that risk.
- Business — what counts as the correct business outcome?
- ML — how is the business objective transformed into classes and data?
- Annotation — how are those rules applied to a specific object?
- QA — how consistently and correctly are the rules applied at scale?
The golden set should not be approved by QA alone
A stronger reference set is reviewed by annotation, QA, a domain expert or client representative, and the ML team. This makes it simultaneously visually, semantically, technically, and aligned with the model task.
Calibrate the team before scaling
Before large-scale annotation, a small joint iteration — for example 100–500 images — can reveal where annotators agree, where they disagree, which questions recur, which classes are unstable, and which examples need to be added to the guideline. This is far cheaper than discovering systematic disagreement after 50,000 annotations.
Version more than the dataset
What happens when the task changes
A new class, defect, SKU, camera, or business criterion should trigger a controlled update: ML analysis, domain validation, new examples, guideline revision, team calibration, annotation, and QA. Otherwise the new rule leaks into the project through informal messages.
Management risk: critical knowledge lives in one person’s head
“Ask one senior annotator — they know how to handle the difficult cases” is not a scalable process. Critical knowledge must be moved into documented rules, visual examples, and a formal workflow.
At minimum, a mature project should link the guideline version, dataset version, and model version. For example, Guideline 1.4 → Dataset 2.1 → Model 3.7. That connection makes it possible to understand months later why a model behaved a certain way and to reproduce the conditions under which it was trained.
Operational KPIs should balance speed and quality
The harder the task, the more important the feedback loop
Communication must flow in both directions. Annotators see thousands of examples and are often the first to notice a new object type, a new defect, a rule conflict, or a new data variant. Their observations should be structured and routed through QA and PM back to the client and ML team.
Scaling should not scale chaos
A mature annotation pipeline should be able to grow from 10 annotators to 50 or 200 without a proportional increase in inconsistency. That requires a shared guideline, training, a golden set, QA, rule versioning, escalation, feedback, and change control.
Annotation is often measured in images per hour, objects per day, and annotation cost. Pushing speed too aggressively can make annotators skip difficult cases, escalate less often, guess more, and spend less time on review. Operational KPIs should therefore combine throughput, quality, rework rate, consistency, and the proportion of disputed cases.
Main takeaway
Business owns the goal. ML owns task formalization. The domain expert owns meaning. PM owns process synchronization. Annotators apply the rules. QA owns stability. Only the interaction of these roles turns a large collection of labels into a dataset that is manageable and suitable for production ML.
9. Legal and Management Risks of a Dataset: Provenance, Personal Data, and Governance
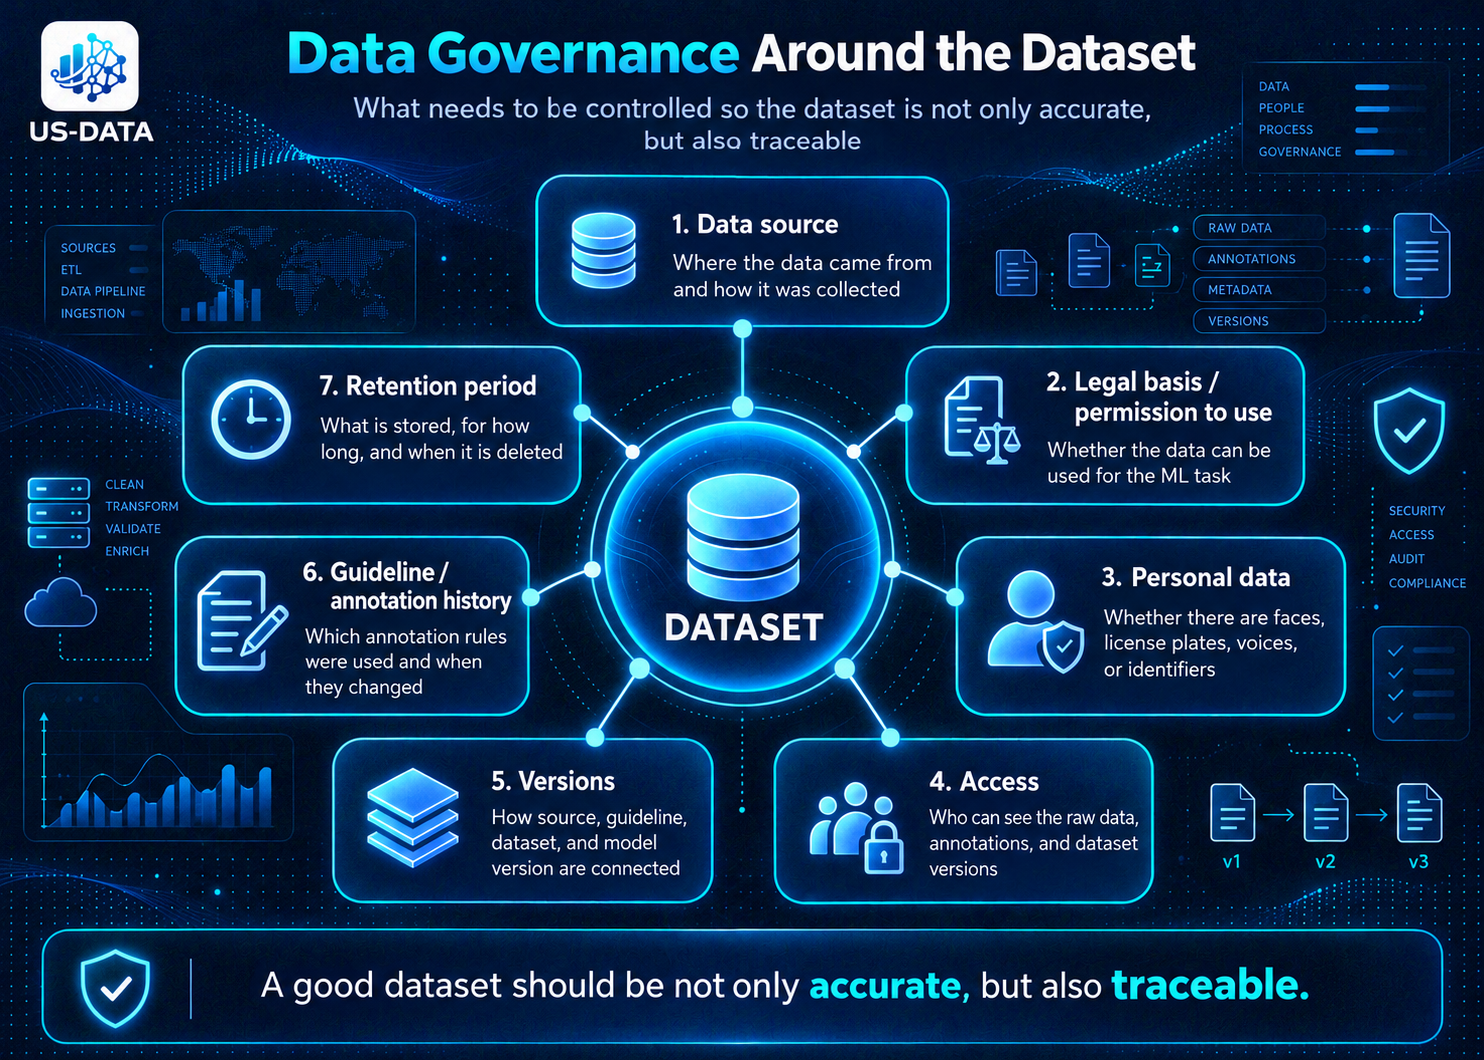
Even a technically strong dataset can become problematic if the team does not know where the data came from, on what basis they may be used, whether they contain personal data, who had access to them, and which rules were used to clean, annotate, and update them.
For an ML project, this is not simply a legal side issue. It is part of dataset quality. If provenance is opaque, neither legal risk, bias, nor production suitability can be assessed reliably.
Can we explain the origin of every important data layer and the history of its changes?
Provenance: every dataset needs a biography
Data provenance is the origin of data and the history of what happened to them. A project should know the source, collection period, who collected the data, under what conditions, which source version was used, whether cleaning or anonymization was applied, who annotated the data, which guideline version was used, what transformations were applied, and which dataset version contains the item.
In practical terms, provenance answers: “How did this file get into the model in this particular form?”
Why provenance affects both legality and quality
A dataset built from known production cameras, with known dates, store locations, camera types, and a consistent preparation pipeline is fundamentally more manageable than a mixed collection in which some images came from the internet, some from a client, some were manually captured, and the source of others is unknown.
Even if both datasets contain the same number of images, only the first supports reliable slicing, root-cause analysis, and reproducibility.
Data governance requirements are becoming more formal
For high-risk AI systems, the EU AI Act explicitly links quality to the organization of training, validation, and test datasets. Article 10 includes data origin and collection, annotation and labeling, cleaning, updating, enrichment, suitability, data quantity, bias analysis, and data gaps among the elements of data governance.
The direction is clear: it is increasingly important not merely to claim that a dataset is good, but to explain why it is good, where it came from, and how it is controlled.
Personal data may appear where the team did not expect it
Computer-vision data may contain faces, license plates, employee badges, screens, documents, addresses, or signs. Audio may contain voices, names, phone numbers, and conversation content. Text datasets may include email addresses, names, addresses, or customer identifiers.
Before data enter the annotation pipeline, the team should determine whether personal or sensitive information is present and whether it is actually necessary for the ML task.
“We only use the data for training” is not enough
If personal data are present, the team must understand the purpose of processing, the legal basis, whether the full volume is necessary, retention periods, who receives the data, and whether identifiability can be reduced.
In the European context, GDPR is built around lawfulness, fairness, transparency, purpose limitation, data minimization, accuracy, storage limitation, integrity/confidentiality, and accountability.
Anonymization and pseudonymization are different
Pseudonymization reduces direct identifiability while preserving the possibility of linking data back to a person using additional information. Anonymization aims at a much stronger outcome in which a person can no longer reasonably be re-identified.
Removing a person’s name from a CSV file does not automatically make the dataset anonymous.
What can be minimized before annotation
- Blur faces when identity is irrelevant.
- Blur license plates.
- Crop unnecessary regions.
- Remove unnecessary metadata.
- Replace direct identifiers with internal IDs.
- Remove text fields not needed by the task.
- Show annotators only the fragment required for their work.
These measures can reduce legal risk, the amount of sensitive information, and the consequences of a potential leak.
Access control is part of the data pipeline
De-identification does not replace organizational controls
Even partially de-identified data may still require role-based access, logging, secure transfer, retention rules, deletion of temporary copies, export controls, and contractual restrictions.
Sensitive projects should define who can see what. An annotator may see only assigned tasks; QA may see the working segment; a PM may manage the project without full raw-data access; the ML team may receive the final dataset. This is the principle of least privilege: give each role only the access it needs.
De-identification does not replace organizational controls. Projects may still need access separation, logging, secure transfer, storage rules, temporary-file deletion, export controls, NDAs, and contractual restrictions.
Document decisions, not only data
Governance is not only for large corporations
Even a small retail ML project can become difficult to maintain if, months later, the team no longer knows where some images came from, which guideline was used, or why old and new labels are mixed together. That is a reproducibility problem even before it becomes a legal one.
Legal risk and ML risk often overlap
Unknown provenance can mean both “we do not know whether we are allowed to use these data” and “we do not know whether they are representative.” Data minimization can also reduce accidental shortcuts and leakage of irrelevant identifiers.
Do we need to keep everything forever?
No. Retention should follow purpose, security requirements, and the applicable legal basis. A data lifecycle should define what is retained, why, for how long, who can access it, and when it is deleted.
External annotation creates an additional transfer risk
Before sending data to a contractor, define what is transferred, what must be de-identified, where processing occurs, who can access raw files, whether downloading is allowed, how working copies are deleted, and which requirements are contractual.
Governance also includes the history of decisions: why a new class was added, why a defect boundary changed, why a source was retired, or why the project moved from guideline 1.3 to 1.4. If such decisions exist only in chat messages, reconstructing project logic months later becomes difficult.
A simple change log may be enough:
| Version | Change | Reason | Affected scope |
|---|---|---|---|
| v1.2 | New class added | New production case | 4,500 images |
| v1.3 | Occlusion rule refined | Low annotator agreement | Class A |
| v2.0 | Taxonomy changed | New business logic | Entire dataset |
Dataset card as a practical tool
The more mature the AI system, the more important data documentation becomes
For production and high-risk use cases, documentation is becoming part of the technical system itself. A useful dataset must answer two questions at once: what is inside, and why is that particular content inside.
Practical checklist before annotation starts
- Origin: where the data came from and whether the source can be confirmed.
- Purpose: why the data are used and whether they match the intended ML task.
- Personal data: whether identifiable data are present and whether they are necessary.
- Minimization: what can be removed or hidden in advance.
- Access: who truly needs raw data.
- Versions: how source, guideline, dataset, and model versions are linked.
- Retention: when temporary and historical copies should be deleted.
A short dataset card can greatly improve manageability. For example:
- Name: Retail Products Dataset v2.4
- Purpose: SKU recognition in production
- Source: store-camera video
- Period: January–June
- Classes: 10 SKUs
- Limitation: does not cover packaging released after July
- Annotation: Guideline v1.7
- QA: double review for hard cases
- Special data: customer faces excluded or de-identified
- Split: train / validation / test
Practice in Russia
For Russian ML projects, the basic legal framework is Federal Law No. 152-FZ “On Personal Data.” If a dataset includes faces, voices, vehicle license plates, documents, contact information, or other identifiers, the legal basis for processing, the circle of people with access, and the need for de-identification should be determined before the data are sent for annotation.
Since September 1, 2025, new Russian requirements and methods for de-identification of personal data have been in force. Roskomnadzor approved separate de-identification requirements by Order No. 140 of June 19, 2025, while the Government of the Russian Federation adopted additional rules and methods by Resolution No. 1154 of August 1, 2025.
The practical point for ML teams is simple: removing a name field is not necessarily sufficient. The full combination of attributes and the possibility of re-identification must be considered. If identifying attributes are not needed by the model, it is safer to minimize them before annotation and to document what was transferred to a contractor, who had access, what transformations were performed, and when working copies must be deleted.
Main takeaway
A mature dataset should be accurate, representative, versioned, traceable, protected, and understandable in terms of both origin and permitted use. The closer an ML system is to production — and the higher the cost of error — the less acceptable it is to rely on “a folder of data” without a controlled history.
10. Datasets 2030: How Annotation Will Change Over the Next 3–5 Years
Over the next three to five years, work with training data will increasingly look less like a one-time dataset-preparation stage and more like a continuous operating loop for ML systems. The reason is not only annotation automation: production constantly creates new environmental states, errors, and borderline cases that must be converted into verified training data.
The classical pipeline was largely linear: collect data, annotate them, train the model, and treat deployment as the end of the project. In production systems, the model and dataset increasingly evolve together.
Human-in-the-loop will remain, but the human role will change
Automatic pre-annotation and model-assisted annotation will absorb more routine and obvious cases. Human effort will concentrate on hard cases, rare classes, ambiguous defects, new categories, low-confidence predictions, and errors that are expensive for the business.
The value of manual annotation will therefore be determined less by raw throughput and more by the quality of decisions on difficult data.
The dataset will become a living object
Mature ML systems will track not only model versions but also dataset versions, guideline versions, production conditions, hard cases, and drift. Versioning, metadata, provenance, dataset monitoring, continuous QA, and governance will become increasingly important.
Teams will collect not more data, but more useful data
One of the central shifts is from the question “How many more images do we need?” to “Which data will improve the next model version the most?” This naturally increases the value of active learning, targeted annotation, error-driven sampling, and automated hard-case discovery.
What to check before changing the model architecture
- Where exactly are the errors concentrated?
- Are the labels correct?
- Are there enough hard cases?
- Does the dataset cover real production conditions?
- Is there class imbalance?
- Has production changed?
- Do annotators interpret the guideline consistently?
- Are train / validation / test split correctly?
- Is the dataset version current?
- Can the problematic segment be repaired locally?
Only after these questions are answered should the team decide whether the bottleneck is truly in the model architecture.
Conclusion
A strong ML model does not begin with the maximum possible amount of data. It begins with a managed cycle of data collection, annotation, QA, training, analysis of production errors, and the return of new examples into the next dataset version.
The faster a team can identify weak points in that cycle and feed them back into the data, the more robust the model becomes. This is why data work is no longer merely a supporting stage of ML development; it is part of the ongoing operation of an AI system.
US-DATA · Data · People · AI
Need to Improve an ML Dataset or Annotation Pipeline?
US-DATA helps AI and ML teams collect, annotate, review, and improve datasets for production systems — from pilot annotation to continuous data improvement, hard-case processing, and multi-level QA.
Why an AI Model Performs Poorly
Download the complete US-DATA guide on dataset quality, annotation QA, hard cases, data drift, continuous annotation, and data governance.